

Range chart for a broad concentration range in the samples
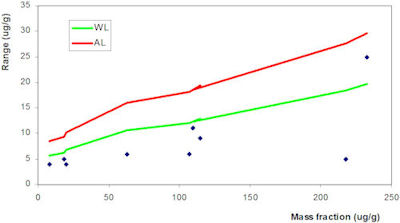
Range chart for results spanning over a concentration interval.
If the results of a given run of analysis cover a wide concentration range, the quality control manager can request a second run. In this run, duplicates of the samples analyzed are submitted to analysis. The values of the ranges are the compared with the expected uncertainty for each concentration of the element. It is understood that the uncertainty has been established during method validation for different concentration levels.
No range shall exceed the action limit calculated as
and only 5 % of the ranges can exceed the warning limit calculated as
An example on how to construct a range chart of this type is provided here.
Please check Microsoft Excel macro's security settings in order to allow code execution before opening the provided document.