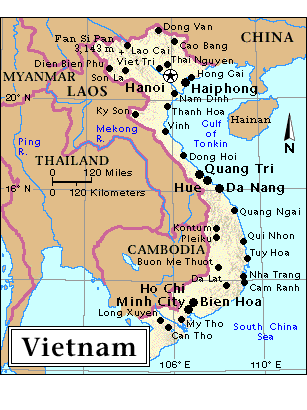
FIG. 1. Map of mainland Vietnam
VIET NAM
(updated on Oct. 20061)
1. ENERGY, ECONOMIC AND ELECTRICITY INFORMATION
1.1. General Overview
Viet Nam, a nation located along the eastern coast of the mainland of Southeast Asia, is shaped like a giant letter S, extending some 1,600 km from the Chinese border to Point Ca Mau (Bai Bung) on the Gulf of Thailand, see Figure 1. The total area of Viet Nam is 329,314 km2. At its widest it reaches a width of about 560 km. In the narrow centre it is less than 50 km wide.
|
FIG. 1. Map of mainland Vietnam |
The altitude of the land is generally high in the north and low in the south. In the north, the coastal plain extends over a fertile delta plain called the Red River Delta, which covers an area of about 14,812 km2. Hanoi, the capital of the country, is located in the delta and the Red River pours into the Gulf of Bac Bo. In the south, the coastal plain widens into the Mekong River Delta, which has an area of about 39,738 km2.
Viet Nam belongs to the Asian Monsoon Zone and gives tropical conditions in the south and sub-tropical conditions in the north. The country enjoys a variety of climatic conditions, including the cool weather in the northern mountain area, the wet tropical climate from northern to central low land, and the tropical monsoon climate in the southern low lands. The wet season lasts from May to October and the dry season from November to April.
In 2005, the population of the country was about 83.120 million of which about 73% lived in rural areas and 27% in urban areas (Table 1). Major urban centres are Ha Noi accounting 3.145 million people, Da Nang 0.78 million and Ho Chi Minh City around 5.891 million. The average population density is about 252 per km2. It varies from one area to another. The population density in the northern Red River Delta is approximately 1,218 per km2, which is near threefold as high as that in the southern Mekong Delta (435 per km2). Meanwhile the population density in the Central Highland area is only 100 per km2. The past 5-year trend of population is given in the Table 2.
TABLE 1. POPULATION INFORMATION
|
|
|
|
|
|
|
|
Average annual growth rate(%) |
|
|
1970 |
1980 |
1990 |
2000 |
2005 |
2006 |
2000 to 2006 |
|
Population (millions) |
42.7 |
53.7 |
66.2 |
77.6 |
83.1 |
84.1 |
1.3 |
|
Population density (inhabitants/km2) |
131.3 |
165 |
203.4 |
249.6 |
268 |
271.3 |
|
|
Urban population (% of total) |
18.3 |
19.2 |
20.3 |
24.3 |
26.4 |
26.9 |
|
|
Area(1000 km2) |
|
|
|
|
|
310.1 |
|
TABLE 2. PAST 5 YEARS TREND OF POPULATION
|
2000 |
2001 |
2002 |
2003 |
2004 |
2005 |
|
|
Population, million persons |
77.64 |
78.7 |
79.7 |
80.9 |
82.032 |
83.12 |
|
Growth rate, % |
1.36 |
1.35 |
1.32 |
1.47 |
1.40 |
1.33 |
Source: Viet Nam Statistical Yearbook, Hanoi 2005 | ||||||
The population growth rate was 2.3% for the period from 1980 to 1985 and 2.0% from 1985 to 1990. In the recent years, the population growth rate is about 1.35 %.
The recent projection of the population showed that total population was expected to increase from 77.9 millions in the year 2000 to 98.4 millions in the year 2020. The statistics of and projection on the population in the period 2000 - 2020 is given in the Table 3.
TABLE 3. PROJECTED POPULATION FOR THE PERIOD 2000-2020
|
Year |
2000 |
2005 |
2010 |
2015 |
2020 |
|
Population, million persons |
77.68 |
83.120 |
88.2 |
92.9 |
98.4 |
|
Growth rate, % |
1.36 |
1.33 |
1.18 |
1.14 |
1.0 |
If in 1995, 80% of the population was distributed in rural areas, now this figure was reduced to 73% in 2005 and downed to 60% by the year 2020. This trend is illustrated in the Table 4.
TABLE 4. THE DISTRUBUTION OF THE POPULATION
Year |
1995 |
2000 |
2005 |
2010 |
2015 |
2020 |
|
Urban, % |
20 |
25.11 |
27 |
32 |
36 |
40 |
|
Rural, % |
80 |
74.89 |
73 |
68 |
54 |
60 |
1.1.1. Economic Indicators
The Vietnamese Government has determined the targets for the economic development for the period 2000-2010 with the main indicators for 2010 are as follows:
The period 2001-2005 witnessed significant innovations in Viet Nam in economic growth, economy structure transition, hunger elimination and poverty reduction, foreign investment attraction,... which created important driving forces contributing to the success of the socio-economic development cause of the Country.
The average GDP growth rate in the period 2001-2005 reached 7.5%. The GDP per capita increased from 399 USD in 2000 to more than 600 USD in 2005. However, the main contributions to the GDP growth are still from capital and labour sources.
During the past five years (2001-2005) there were considerable changes in density of economic sectors. Agriculture density decreased from 24.5% in 2000 to about 19% in 2005, meanwhile industry increase from 36.7% in 2000 to about 42% in 2005. Service has been maintained at 38-39%. The trend of the economic development over the past 5 years is given in the Table 5 and that of the export and import of goods is given in the Table 6. Exports include crude oil, rice, marine products, coal, coffee and rubber and imports petroleum products, steel products, tractors, cotton and textiles.
TABLE 5.1. ECONOMIC DEVELOPMENT AND STRUCTURE
Parameters |
1995 |
2000 |
2001 |
2002 |
2003 |
2004 |
2005 |
|
GDP growth rate, % |
9.54 |
6.79 |
6.89 |
7.08 |
7.34 |
7.79 |
8.43 |
|
GDP1 Billion VND |
228,892 |
441,646 |
481,295 |
536,098 |
613,443 |
715,307 |
837,858 |
|
Million USD |
20,808 |
31,546 |
33,193 |
35,739 |
40,090 |
45,835 |
53,030 |
|
GDP per Sector: |
|
|
|
|
|
|
|
|
Agriculture, Forestry & Fishing, % |
27.18 |
24.53 |
23.24 |
23.03 |
22.54 |
21.81 |
20.89 |
|
Industry & Construction, % |
28.76 |
36.73 |
38.13 |
38.49 |
39.47 |
40.21 |
41.04 |
|
Service, % |
44.06 |
38.73 |
38.63 |
38.48 |
37.99 |
37.98 |
38.07 |
1 at current prices | |||||||
Source: Viet Nam Statistical Yearbook, Hanoi 2005 | |||||||
Source: World Bank World Development
Indicator
TABLE 5.2. GROSS DOMESTIC PRODUCT (GDP)
|
|
|
|
|
|
|
|
Average annual growth rate(%) |
|
|
1970 |
1980 |
1990 |
2000 |
2005 |
2006 |
2000 to 2006 |
|
GDP (millions of current US$) |
|
|
6 471.7 |
31 172.5 |
52 917.4 |
60 883.8 |
11.8 |
|
GDP (millions of constant 2000 US$) |
|
|
15 018.0 |
31 172.5 |
44 765.1 |
48 420.6 |
7.6 |
|
GDP per capita (current US$) |
|
|
97.8 |
401.5 |
636.8 |
723.9 |
10.3 |
Source: World Bank World Development
Indicator
TABLE 6. THE EXPORT AND IMPORT OF GOODS
Parameters |
1995 |
2000 |
2001 |
2002 |
2003 |
2004 |
2005 |
|
Export, million USD |
5,448.9 |
14.483 |
15,029 |
16,760 |
20.1 |
26.5 |
32.4 |
|
Import, million USD |
8,155.4 |
15,636 |
16,218 |
19,733 |
25.2 |
32.0 |
37.0 |
|
Balance |
-2,706.5 |
-1,153 |
-1,189 |
-3,027 |
-5.1 |
-5.5 |
-4.6 |
Source: Viet Nam Statistical Yearbook, Hanoi 2005 | |||||||
1.1.2. Energy Situation
The overall Viet Nam's energy reserves are given in Table 7.
TABLE 7. ESTIMATED ENERGY RESERVES
| Estimated energy reserves in (*) (Solid and Liquid in million tons, Uranium in metric tons, Gas in billion cubic metres, Hydro in TWhr per year) | ||||||||
| Solid (1) | Liquid (2) | Gas (3) | Uranium (4) | Hydro (5) | ||||
|---|---|---|---|---|---|---|---|---|
| Amount | 150 | 338,000 | 193 | 1,005 | 100,000 | |||
(*) Sources: 20th WEC Survey of Energy
Resources, 2004 and Uranium 2005: Resources, Production and Demand ("Red Book")
(1) Coal including Lignite: proved recoverable reserves, the tonnage within the
proved amount in place that can be recovered in the future under present and
expected local economic conditions with existing available technology
(2) Crude oil and natural gas liquids (Oil Shale, Natural Bitumen and
Extra-Heavy Oil are not included): proved recoverable reserves, the quantity
within the proved amount in place that can be recovered in the future under
present and expected local economic conditions with existing available
technology
(3) Natural gas: proved recoverable reserves, the volume within the proved
amount in place that can be recovered in the future under present and expected
local economic conditions with existing available technology
(4) Reasonably Assured Resources (RAR) under < USD 130/kgU
(5) Hydropower: technically exploitable capability, the amount of the gross
theoretical capability that can be exploited within the limits of current
technology
Source: IAEA Energy and Economic Database.
1.1.2.1. Coal
As of January 2005, the total coal amount of surveyed reserves (grades A+B+C+P) in Viet Nam is about 6,164 million tons, of which the reserves at the grades: A+B+C: 4,992 million tons (80.9%), A+B: 370 million tons (6.0%), C1: 2,157 million tons (34,9%), P: 1,172 million ton (19.0%).
Data of the past 5 years of coal production and coal use is given in Table 8 and the projected coal-production in Table 9.
TABLE 8. COAL PRODUCTION AND COAL USE
|
Parameters |
1995 |
2000 |
2001 |
2002 |
2003 |
2004 |
2005 |
|
Coal prod., million tons |
8.35 |
11.61 |
13.40 |
16.41 |
19.31 |
27.35 |
32.4 |
|
Coal Export., million tons |
2.80 |
3.25 |
4.29 |
6.05 |
7.26 |
11.64 |
17.99 |
|
Domestic use, million tons |
4.84 |
8.36 |
9.11 |
10.36 |
12.04 |
15.71 |
14.41 |
Source: Viet Nam Statistical Yearbook, Hanoi 2005 | |||||||
TABLE 9. PROJECTED COAL PRODUCTION AND CONSUMPTION
|
Parameters |
2010 |
2015 |
2020 |
|
Projected-coal production, million tons |
42 - 48 |
50 - 57 |
54 - 64 |
|
Demand for elect. prod., million tons |
16.3 - 21.9 |
27.4 - 29.4 |
32.7 - 40.4 |
|
Demand for Exp. & other, million tons |
|
|
|
Source: Vinacoal | |||
1.1.2.2. Oil, Gas & Petroleum products
Exploration of oil and gas in Viet Nam has been carried out since 1959. The potential reserves of oil & gas are estimated from 4-4.5 billion m3 oil equivalent, of which 1.6-1.8 billion m3 Condensate and 2.4-2.7 billion m3 natural gas. According to the energy experts, the crud oil production reaches 10-18 million tons/year in 2020 and gas production reaches 14-19 billion m3 in 2025.
At the present time, almost all crude oil is exported, while the domestic demand in petroleum products is met by import. A refinery with a capacity of 6.5 million tons/year is now under construction and will be put into operation in 2009. The past 5 years of oil & gas production is given in Table 10. The projected oil & gas production is given in Table 11.
TABLE 10. OIL & GAS PRODUCTION
Parameters |
1995 |
2000 |
2001 |
2002 |
2003 |
2004 |
2005 |
|
Crude oil, million tons |
7.62 |
16.29 |
16.83 |
17.09 |
17.7 |
20.05 |
18.52 |
|
Natural gas, billion m3 |
0.21 |
1.721 |
1.724 |
2.25 |
3.0 |
4.6 |
5.2 |
|
Imported petr. products, million tons |
5.0 |
8.75 |
9.08 |
9.97 |
9.94 |
11.05 |
11.48 |
Source: Petrovietnam | |||||||
TABLE 11. PROJECTED OIL & GAS PRODUCTION
|
Parameters |
2005 |
2010 |
2020 |
|
Projected-oil production, million tons |
18.60 |
16-18 |
32-35 |
|
Projected-gas production, billion m3 |
6.89 |
12-14 |
18-23 |
|
Import petroleum products, million tons |
11.48 |
3.86 |
9.70 |
Source: Petrovietnam | |||
1.1.2.3. Hydro power potential
With more than 2,200 rivers and streams of length of from 10 km, the total technical reserve for hydroelectric power of Viet Nam is estimated at 30,000 MW with an annual electricity output of 120 TWh. If taking environment protection into consideration, the total techno-economic potential of hydropower will be about 83 TWh. In addition to the big hydropower projects, Viet Nam has a rather high potential on small and extreme small hydropower sources. A preliminary estimation showed that Viet Nam could get 2,300 MW from small and extreme hydropower sources with electricity generation from 8-10 TWh.
1.1.2.4. Uranium
Currently, there is no nuclear power in Viet Nam. Uranium ore has been found in the northern and central regions of Viet Nam. These uranium deposits have been estimated to hold about 218,167 tons of U3O8, with a low average uranium oxide content of 0.06%.
1.1.2.5. New and Renewable Energy
Geothermal Energy
There is a potential for geothermal energy in Viet Nam since it has more than 300 hot-water areas, with a surface water temperatures ranging from 30°C to 105°C. Recently, an American company, ORMAT, carried out a study at 60 hot-water areas and has chosen 6 sites, mostly in the central and south regions of Viet Nam, for installations of geothermal plants with a total capacity of about 200 MW by 2020.
Solar Energy
Viet Nam is a tropical country with an average sunlight of 2000 to 2500 hours per year and a total average solar radiation of 150 kcal/cm2 per year. The theoretical potential is estimated about 43.9 Bill TOE/year
Wind Energy
Potential of wind energy in Viet Nam is small. energy density is about 800-1,400 kWh/m2.year at islands and 500-1,000 kWh/m2.year at the Central Highland and coast, and is less than 500 kWh at the remaining areas.Biomass
Biomass resources in Viet Nam include wood and agriculture wastes and are estimated to be about 43 to 46 million TOE/year. The respective shares for wood and agriculture wastes are about 60% and 40%, respectively. The potential biomass energy is estimated to be about 0.4 million TOE/year. Although the resources are significant, there are environmental concerns with using wood products for electricity generating.
1.1.2.6. Energy
The basic energy situation of Viet Nam is given in Table 12.
TABLE 12. ENERGY STATISTICS(*)
|
Average annual |
|||||||
|
|
1970 |
1980 |
1990 |
2000 |
2002 |
2005 |
1970 |
2000 |
|
Energy consumption |
|
|
|
|
|
|
|
|
|
- Total(1) |
0.53 |
0.40 |
0.57 |
1.13 |
1.21 |
1.31 |
0.42 |
3 |
|
- Solids(2) |
0.23 |
0.33 |
0.39 |
0.55 |
0.57 |
0.33 |
2.61 |
-10 |
|
- Liquids |
0.29 |
0.05 |
0.13 |
0.38 |
0.40 |
0.53 |
-3.89 |
6.8 |
|
- Gases |
|
|
|
0.05 |
0.10 |
0.26 |
|
39 |
|
- Primary electricity(3) |
0.01 |
0.01 |
0.05 |
0.15 |
0.15 |
0.19 |
11.44 |
4.8 |
|
|
|
|
|
|
|
|
|
|
|
Energy production |
|
|
|
|
|
|
|
|
|
- Total |
0.25 |
0.36 |
0.57 |
1.54 |
1.86 |
2.01 |
4.28 |
5.5 |
|
- Solids |
0.24 |
0.35 |
0.40 |
0.66 |
0.69 |
0.76 |
2.63 |
2.8 |
|
- Liquids |
|
|
0.11 |
0.68 |
0.92 |
0.8 |
|
3.3 |
|
- Gases |
|
|
|
0.05 |
0.10 |
0.26 |
|
39 |
|
- Primary electricity(3) |
0.01 |
0.01 |
0.05 |
0.15 |
0.15 |
0.19 |
11.44 |
4.8 |
|
|
|
|
|
|
|
|
|
|
|
Net import (Import - Export) |
|
|
|
|
|
|
|
|
|
- Total |
0.28 |
0.04 |
0.00 |
-0.36 |
-0.46 |
-0.5 |
18.63 |
6.8 |
|
- Solids |
-0.01 |
-0.01 |
-0.02 |
-0.10 |
-0.09 |
-0.45 |
5.97 |
35 |
|
- Liquids |
0.29 |
0.05 |
0.02 |
-0.27 |
-0.37 |
-0.05 |
-12.88 |
29 |
|
- Gases |
|
|
|
|
|
|
|
|
|
|
|
|
|
|
|
|
|
|
|
(1) Energy consumption = Primary energy consumption + Net import (Import - Export) of secondary energy. |
||||||||
(2) Solid fuels include coal, lignite and commercial wood. |
||||||||
(3) Primary electricity = Hydro + Geothermal + Nuclear + Wind. |
||||||||
(*) Energy values are in Exajoule except where indicated. |
||||||||
Source: IAEA Energy and Economic Database. |
||||||||
1.2. Energy Policy
With the target of serving to industrialization and modernization cause of the country, increasing people's living standards, the Viet Nam's Energy Policy consists of the following basic issues:
Strategy and Policy on Electricity Development
Some Implementation Measures
Electricity Price
Mobilization of investment sources
Establish and develop electricity market
Plan after 2010
1.3. The Electricity System
1.3.1. Structure of the Electricity Sector
a. Government:
- The owner of capitals, assets, property of the State at the electricity businesses;
- Decide on price tariff for end-customers;
- Enact decisions, decrees, regulations,... and
- Approve planning and plans for electricity development.
b. Ministry of Industry (MOI)
- Manage and regulate electricity activities and uses;
- Instruction on implementation of decrees issued by the Government;
- Enact specific regulatory documents; and
- Organize formulation and appraisement planning and plans for electricity development.
c. Electricity Regulatory Authority of Viet Nam
- Licensing for electricity activities;
- Assist the MOI Minister in regulating competitive electricity market activities;
- Advise the MOI Minister on making decision on cost frames of electricity generation, wholesale, transmission, distribution, and other service in the competitive electricity market.
d. Electricity of Viet Nam (EVN)
Electricity of Viet Nam (EVN) is the unique state-owned electricity utility in Viet Nam operating under management of the MOI. Electricity supply regime is divided according to the regions: northern, central, and southern. Supply system operation and management responsibilities in each region are Northern Elect. Co., Central Elect. Co., Southern Elect. Co., Ha Noi Elect. Co., and Ho Chi Minh Elect. Co.
Under EVN, there are A/Es, electrical power plans, transmission companies.
e. Non-EVN Electricity Generation Companies
At present, there are BOT, IPP, joint-stock electricity power generation and distribution companies. As of June 2005, total installed capacity of non-EVN electricity generation companies is 2,439 MW accounting for 21.6% of total installed capacity of Viet Nam.
1.3.2. Decision Making Process
From 1996, studies on sustainable energy development, including consideration of the role of nuclear power in the national energy system, have been being carried out in Vietnam. Many ministries, organization, universities, and research institutes have been involved in the studies, such as:
During the period 1996-2006, the Government of Vietnam has approved and provided financial budgets to the following programme and projects:
The studies cover a rather wide range of aspects related to energy:
1.3.3. Main Indicators
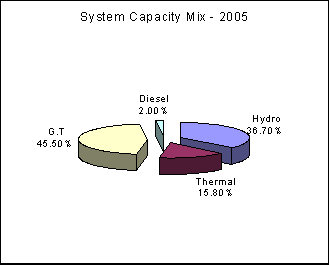
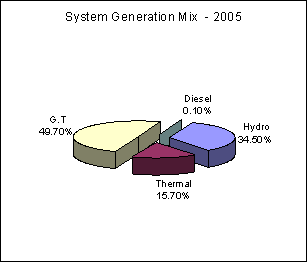
Presently, the hydro power plants are still predominant in the electricity system of Viet Nam, not only in installed capacity, but also in the generation terms. By the end of 2005, the total installed capacity of the electricity generating system was 11,994 MW, of which 34.5% was hydropower, and the total electric generation was 53,438 GW·h, of which 36.7% was hydropower. The structure of the generating mix is given in Table 13 and Figure 2.
TABLE 13. THE STRUCTURE OF THE GENERATING MIX (year 2005)
|
Type of Plants |
Capacity, MW |
Share, % |
Electricity, GW·h |
Share, % |
|
1. Hydro |
4,401 |
36.7 |
18,541 |
34.5 |
|
2. Thermal |
1,900 |
15.8 |
8,408 |
15.7 |
|
3. Gas Turbine |
5,453 |
45.5 |
26,527 |
49.7 |
|
4. Diesel |
240 |
2 |
53 |
0.1 |
|
Total |
11,994 |
100 |
53,438 |
100 |
Source: EVN | ||||
The structure of the electricity generation and consumption over the past 5 years is given in Tables 14 and 15 and the EDB statistics and energy related ratios in Tables 16 and 17.
TABLE 14. THE STRUCTURE OF ELECTRICITY GENERATION
Structure |
1995 |
2000 |
2001 |
2002 |
2003 |
2004 |
2005 |
|
Total production, GW·h |
14636 |
26,594 |
30,603 |
35,800 |
40,825 |
46,201 |
53,320 |
|
Hydro,% |
72.3 |
54.7 |
59.5 |
50.9 |
46.5 |
38.2 |
34.5 |
|
Thermal,% |
20.0 |
22.3 |
21.1 |
15.6 |
17.7 |
15.2 |
15.7 |
|
GT & Diesel,% |
7.7 |
23.0 |
19.4 |
33.5 |
35.8 |
46.6 |
49.8 |
|
Total system loss, % |
21.7 |
15 |
14.6 |
14 |
13.7 |
13.3 |
13.0 |
Source: EVN | |||||||
|
FIG. 2. The structure of the generating mix |
TABLE 15. THE STRUCTURE OF ELECTRICITY CONSUMPTION
|
Structure |
1995 |
2000 |
2001 |
2002 |
2003 |
2004 |
2005 |
|
Industry,% |
41.2 |
40.6 |
40.4 |
41.9 |
43.8 |
45.1 |
46.7 |
|
Agriculture,% |
5.6 |
1.9 |
1.9 |
1.7 |
1.6 |
1.4 |
1.3 |
|
Household, service,% |
44.1 |
49.0 |
49.1 |
53.8 |
50.0 |
49.0 |
48.2 |
|
Other,% |
9.1 |
8.5 |
8.6 |
3.6 |
4.5 |
4.6 |
3.8 |
Source: EVN | |||||||
TABLE 16. ELECTRICITY PRODUCTION AND INSTALLED CAPACITY
|
Average annual |
|||||||
|
1970 |
1980 |
1990 |
2000 |
2002 |
2005 |
1970 |
2000 |
|
Electricity production (TW·h) |
|
|
|
|
|
|
|
|
|
- Total(1) |
2.12 |
4.21 |
8.72 |
26.59 |
35.80 |
53.32 |
7.33 |
15.4 |
|
- Thermal |
1.51 |
2.90 |
3.35 |
11.38 |
16.93 |
34.92 |
4.08 |
25.1 |
|
- Hydro |
0.62 |
1.20 |
5.37 |
14.55 |
18.20 |
18.39 |
11.44 |
4.7 |
|
- Nuclear |
|
|
|
|
|
|
|
|
|
- Geothermal |
|
0.11 |
|
0.67 |
0.67 |
|
|
|
|
|
|
|
|
|
|
|
|
|
|
Capacity of electrical plants (GWe) |
|
|
|
|
|
|
|
|
|
- Total |
0.56 |
1.19 |
2.13 |
5.90 |
8.75 |
11.994 |
6.90 |
15.6 |
|
- Thermal |
0.40 |
0.89 |
1.40 |
2.36 |
4.55 |
7.593 |
6.52 |
26.3 |
|
- Hydro |
0.16 |
0.25 |
0.68 |
3.46 |
4.12 |
4.401 |
7.33 |
4.9 |
|
- Nuclear |
|
|
|
|
|
|
|
|
|
- Geothermal |
|
0.05 |
0.05 |
0.08 |
0.08 |
|
|
|
|
- Wind |
|
|
|
|
|
|
|
|
|
|
|
|
|
|
|
|
|
|
(1) Electricity losses are not deducted. |
||||||||
(*) Energy values are in Exajoule except where indicated. |
||||||||
TABLE 17. ENERGY RELATED RATIOS
|
1970 |
1980 |
1990 |
2000 |
2002 |
2005 |
|
Energy consumption per capita (GJ/capita) |
12 |
7 |
9 |
14 |
15 |
16 |
|
Electricity per capita (kW·h/capita) |
50 |
73 |
131 |
341 |
449 |
643 |
|
Electricity Production/Energy production (%) |
8 |
11 |
15 |
17 |
15 |
9.45 |
|
Nuclear/Total electricity (%) |
|
|
|
|
|
|
|
Ratio of external dependency (%)(1) |
53 |
10 |
-1 |
-32 |
-38 |
-38.2 |
|
Load factor of electricity plants |
|
|
|
|
|
|
|
- Total (%) |
43 |
41 |
47 |
60 |
60 |
64 |
|
- Thermal |
43 |
37 |
27 |
64 |
61 |
66 |
|
- Hydro |
43 |
55 |
91 |
57 |
57 |
61 |
|
- Nuclear |
|
|
|
|
|
|
(1) Net import / Total energy consumption. | ||||||
Source: IAEA Energy and Economic Database. | ||||||
1.3.4. Transmission
Viet Nam’s electricity system is operating with voltages 500 kV, 220 kV, 110 kV and 35 kV to 6 kV. Table 18 shows development of transmission grid and transformers during last 15 years.
TABLE 18. AMOUNT OF LINES AND TRANSFORMERS
Year |
1990 |
1995 |
2000 |
2005 |
||||
|
km |
MVA |
km |
MVA |
km |
MVA |
km |
MVA |
500 kV |
|
1,487 |
2,850 |
1,532 |
2,850 |
2,469 |
6,150 |
|
220 kV |
1,359 |
1,544 |
2,272 |
3,038 |
3,519 |
6,726 |
4,795 |
14,890 |
66-110 kV |
4,265 |
2,603 |
6,069 |
3,466 |
7,909 |
8,193 |
9,819 |
18,609 |
6-35 kV |
|
|
39,539 |
8,400 |
59,533 |
12,728 |
115,308 |
28,604 |
2. NUCLEAR POWER SITUATION1
2.1. Historical Development and current nuclear power organizational structure1
Not applicable.
2.2. Nuclear Power Plants: Status and Operations1
Not applicable.
2.3. Supply of NPPs1
Not applicable.
2.4. Operation of NPPs1
Not applicable.
2.5. Fuel Cycle and Waste Management1
Management of radioactive waste in Viet Nam:
2.6. Research and Development1
One of the agencies under MOST is the Viet Nam Atomic Energy Commission (VAEC). The VAEC was established in April 1976 and up to April 1994 it was controlled under the Prime Minister’s office. In April 1994, VAEC was reorganized and put under MOST. The VAEC comprises the following institutions:
The functions and duties of the VAEC are as follows:
2.7. International Co-operation and Initiatives
Brief description of research and development activities carried out jointly with other countries and/or within the framework of international projects, technical and industrial co-operation, transfer of know-how and technology.
INTERNATIONAL AGREEMENTS |
||
|
• NPT related safeguards agreement INFCIRC/376. |
Entry into force: |
23 February 1990 |
|
• Improved procedures for designation of safeguards inspectors |
Prefers to apply the present system |
19 June 1990 |
|
• Supplementary agreement on provision of technical assistance by the IAEA |
Entry into force: |
01 May 1983 |
|
• RCA |
Entry into force: |
28 August 1997 |
|
• Agreement on privileges and immunities |
Entry into force: |
31 July 1969 |
|
• NPT |
Entry into force: |
14 June 1982 |
|
• Convention on physical protection of nuclear material |
|
Non-Party |
|
• Convention on early notification of a nuclear accident |
Entry into force: |
30 October 1987 |
|
• Convention on assistance in the case of a nuclear accident or radiological emergency |
Entry into force: |
30 October 1987 |
|
• Safeguards Agreement, |
signed |
1989. |
|
• Bangkok Treaty: South East Asia Nuclear Weapons Free Zone, |
signed |
December 1995 |
|
• Comprehensive Nuclear-Test-Ban Treaty signed (CTBT) |
signed |
1996 |
|
• Vienna convention on civil liability for nuclear damage |
Non-Party |
|
|
• Joint protocol |
Non-Party |
|
|
• Protocol to amend the Vienna convention on civil liability for nuclear damage |
Not signed |
|
|
• Convention on supplementary compensation for nuclear damage |
Not signed |
|
|
• Convention on nuclear safety |
Non-Party |
|
|
• Joint convention on the safety of spent fuel management and on the safety of radioactive waste management |
Not signed |
|
|
• ZANGGER Committee |
Non-Member |
|
|
• Nuclear Export Guidelines |
Not adopted |
|
|
• Acceptance of NUSS Codes |
No reply |
|
|
• Nuclear Suppliers Group |
Non-Member |
|
BILATERAL AGREEMENTS |
|
|
• Agreement between the government of the Socialist Republic of Vietnam and the government of the Republic of India for the co-operation for utilization of atomic energy for peaceful purposes. |
signed in 1986 |
|
• Agreement between the government of the Republic of Korea and the government of the Socialist Republic of Vietnam for the co-operation in the peaceful uses of nuclear energy. |
signed in 1996 |
|
• Co-operation agreement on peaceful uses of advanced nuclear technology between Viet Nam Atomic Energy Commission (VAEC) and the French Atomic Energy Commission (CEA). |
signed in 1996 |
|
• Agreement between the Government of the Socialist Republic of Viet Nam and the Government of the People's Republic of China for the co-operation in the peaceful uses of nuclear energy. |
signed in 2000 |
|
• Agreement between the Government of the Socialist Republic of Viet Nam and the Government of the Argentine Republic for the co-operation in the peaceful uses of nuclear energy. |
signed in 2001 |
|
• Agreement between the Government of the Socialist Republic Viet Nam and the Government of the Russian Federation for the co-operation in the peaceful uses of nuclear energy. |
signed in 2002 |
3. NATIONAL LAWS AND REGULATIONS1
3.1. Safety Authority and the Licensing Process
On the basis of the Viet Nam Radiation Protection and Nuclear Safety (VRPA), the Viet Nam Agency for Radiation and Nuclear Safety & Control (VARANSAC) was established in 2004. VARANSAC is under the MOST and is to assist the MOST's Minister in exercising the state management of radiation protection and nuclear safety.
Licensing and inspection: VARANSAC issues licenses for all activities related to radiation including import and export of radiation sources, radiation works, radiation facilities. Every year inspection is carried out for some radiation organizations.
The functions and duties of VARANSAC are as follows:
3.2. Main National Laws and Regulations in Nuclear Power
4. CURRENT ISSUES AND DEVELOPMENTS ON NUCLEAR POWER
In 1996, the Government assigned the MOI and MOST in collaboration with the related ministries and organizations to begin conducting studies on the introduction of the nuclear power into Viet Nam. The studies cover all topics related to NPP’s introduction into the country, including electricity demands and supply, economy, finance, technology, safety, radioactive waste management, nuclear law and regulation, site selection, manpower, public acceptance, international relations, etc. The obtained results showed that by 2015 Viet Nam would be changed from an energy export country to an energy import country; and Viet Nam should consider NPPs’ construction.
May 2001, Prime Minister decided to establish a National Steering Committee on Study on Nuclear Power Development in Viet Nam with three major tasks:
In addition, in 2003, The National Assembly assigned the MOST to formulate Atomic Energy Law. In October 2005, the MOI's Minister submitted to the Government the Final Report on Pre-FS. After that in January 2006, the Prime Minister has approved the National Strategy for Peaceful Utilizations of Atomic Energy.
The Strategy and Pre-FS concluded that In order to meet electricity demand by 2020, Viet Nam should:
According to the recent study results, nuclear power should be introduced into Viet Nam. The first NPP would be occurred in the period 2020 - 2025 with installed capacities from 2000 MW to 4000 MW representing from 3.3% to 4.7% of total installed capacity.
Appendix
DIRECTORY OF THE MAIN ORGANIZATIONS, INSTITUTIONS AND COMPANIES INVOLVED IN NUCLEAR POWER RELATED ACTIVITIES
NUCLEAR ENERGY AUTHORITY | |
|
Vietnam Atomic Energy Commission |
Tel: 844 9423479 |
|
Ministry of Science, Technology and Environment |
|
|
OTHER ORGANIZATIONS |
|
|
Institute for Nuclear Science and Technique (INST) |
Tel: (844)8361432 |
|
Nuclear Research Institute (NRI) |
Tel: (8463)822191 |
|
Centre for Nuclear Techniques (CNT) |
Tel: (848)8356568 |
|
Institute for Technology of Radioactive and Rare Elements (ITRE) |
Tel: 844)7760340 |
|
Vietnam Information for Science and Technology Advance |
|
|
RCA (Regional Co-operative Agreement) Vietnam |
|
_______________________________________
1. The statistical tables in this profile have been updated with data as of the end of 2007 from IAEA databases, namely the Power Reactor Information System (PRIS) and Energy and Economic Data Bank (EEDB), and the World Bank's World Development Indicators (WDI).