BRAZIL
1. ENERGY, ECONOMIC AND ELECTRICITY INFORMATION
1.1. General Overview
Brazil is a federal republic in South America, bounded on the north, west and
south by every country of the continent except Chile and Ecuador, and on the
east by the Atlantic Ocean, along 7,400 km (4,600 miles) of coastline. The country
covers an area of 8,514,215.3 km2, about half of all South America, and is the
world's fifth largest country in area. In 2002, the population of Brazil was
about 176.3 million corresponding to a population density of 20.7 inhabitants
per km2 The predicted population growth rate from 2002 to 2010 is 8.6%. Most
Brazilians live in high-density areas of eastern Brazil or along the coast or
the major rivers. Today, about 82.3% of the people live in urban areas.
The single most important influence on Brazil's climate is its location on the equator. Temperatures seldom exceed 35oC in the tropics owing to the moderating effects of high atmospheric humidity. Most of Brazil receives a moderate rainfall of 1,000-1,500 mm (40-60 in), although the Amazon lowlands and several other areas receive more than 2,030 mm (80 in) of rainfall annually. The semi-arid northeastern interior, or 'Sertao', frequently suffers from very long droughts. Tropical rain forest, or 'Selva', is found in the wettest part of the Amazon Basin. Much of the south and southwest of Brazil is covered by savanna, or tropical grassland, and in the interior of the northeast, caatinga, a low and bushy scrub and thorn forest is characteristic.
Brazil's three major river systems are: the Parana-Paraguay-Plata in the south, the Sao Francisco in the east, and the Amazon in the north. The Amazon, the major river of South America, is the world's second longest river (6,440 km/4,000 miles), and most of its basin lies within Brazil. The Amazon river's major tributaries are the Tocantins-Araguaia, the Madeira, the Negro, the Xingu and the Tapajos.
According the IAEA Energy and Economic Database, in 2002, the Gross Domestic Product (GDP) was 525,782 millions of current US$ and the GDP per capita was 2,983 current US$.
Brazil has modest fossil energy resource and one of the largest hydroelectric potential in the world. The hydro resources located in the north-east, south-east and south of the country have already been thoroughly surveyed. The hydroelectric potential of north and central west regions, which cover practically Brazil's Amazon area, are being tapped to partially meet both regional and national electric needs. According IAEA Energy and Economic Data Base, Brazilian estimated energy reserves are:: 196.83 EJ (Exajoules) solid fuels, 49.22 EJ liquid fuels, 9.01 EJ gas, 88.45 EJ uranium (essentially recoverable reserves), 293.06 EJ hydro (for comparison purposes a rough attempt was made to convert hydro capacity to energy by multiplying the gross theoretical annual capability by a factor of 10).
Historically, the expansion of the energy sector represented a dynamic aspect
on the process of industrialization and modernization of economic and social
structures in Brazil. This expansion has provided the energy needed for this
process and has stimulated the development of productive sectors. During the
last decades, Brazilian development was mainly induced by the State's direct
action. Table 1 shows the historical energy statistics.
As shown in Table 1, during the period 1970 to 1990 the total energy production
experienced an average annual growth rate of 4.72% and during the 1990's and
early 2000's it had a small decrease to 3.82% per year. Primary electricity
production had a different pattern: the average annual growth rate decreased
from 8.63% from 1970 to 1990 to about 3.73% during 1990 to 2002.
Final energy consumption in Brazil reached 9.69 EJ in 2002, a bit more than
three times the 1970 figure of 2.88 EJ. The share of liquid fuels in primary
energy consumption had a small increase from 37.8% in the 1970's to 42.2% in
2002. On the other side, the share of solid fuels went down from 48.6% to 17.1
during the same period. Primary electricity (hydro and nuclear) and gas provided
37.0% and 3.7%, respectively, of primary energy consumption in 2002.
TABLE 1. BASIC ENERGY SITUATION*
|
|
|
|
|
|
|
|
Average annual |
|
|
|
|
|
|
|
|
|
growth rate (%) |
|
|
|
|
|
|
|
|
|
1970 |
1990 |
|
|
1970 |
1980 |
1990 |
2000 |
2001 |
2002 |
To |
To |
|
|
|
|
|
|
|
|
1990 |
2002 |
|
|
|
|
|
|
|
|
|
|
|
Energy consumption |
|
|
|
|
|
|
|
|
|
- Total (1) |
2.88 |
5.51 |
6.89 |
9.43 |
9.60 |
9.69 |
4.45 |
2.87 |
|
- Solids (2) |
1.40 |
1.89 |
1.69 |
1.68 |
1.66 |
1.66 |
0.94 |
-0.15 |
|
- Liquids |
1.09 |
2.34 |
2.80 |
3.98 |
4.04 |
4.08 |
4.81 |
3.19 |
|
- Gases |
|
0.04 |
0.15 |
0.35 |
0.35 |
0.36 |
21.32 |
7.63 |
|
- Primary electricity (3) |
0.38 |
1.24 |
2.25 |
3.42 |
3.54 |
3.58 |
9.25 |
3.93 |
|
Energy production |
|
|
|
|
|
|
|
|
|
- Total |
2.09 |
3.56 |
5.27 |
7.57 |
8.00 |
8.27 |
4.72 |
3.82 |
|
- Solids |
1.35 |
1.78 |
1.38 |
1.24 |
1.28 |
1.28 |
0.13 |
-0.64 |
|
- Liquids |
0.36 |
0.51 |
1.72 |
3.07 |
3.36 |
3.58 |
8.16 |
6.26 |
|
- Gases |
|
0.04 |
0.15 |
0.26 |
0.28 |
0.29 |
21.31 |
5.55 |
|
- Primary electricity (3) |
0.38 |
1.24 |
2.01 |
3.00 |
3.09 |
3.12 |
8.63 |
3.73 |
|
Net import (Import - Export) |
|
|
|
|
|
|
|
|
|
- Total |
0.84 |
1.95 |
1.50 |
1.62 |
1.77 |
3.41 |
2.98 |
7.05 |
|
- Solids |
0.05 |
0.13 |
0.31 |
0.43 |
0.43 |
0.43 |
9.10 |
2.73 |
|
- Liquids |
0.78 |
1.82 |
1.19 |
1.11 |
0.88 |
0.51 |
2.14 |
-6.77 |
|
- Gases |
|
|
|
0.08 |
0.45 |
2.46 |
|
|
|
|
|
|
|
|
|
|
|
|
|
|
|
|
|
|
|
|
|
|
|
(1) Energy consumption = Primary
energy consumption + Net import (Import - Export) of secondary energy. |
|
|
||||||
|
(2) Solid fuels include coal,
lignite and commercial wood. |
|
|
|
|
|
|
||
|
(3) Primary electricity =
Hydro + Nuclear. |
|
|
|
|
|
|||
|
(*) Energy values are in Exajoule
except where indicated. |
|
|
|
|
|
|
||
Source: IAEA Energy and Economic Database.
1.2 Energy Policy
The Brazilian energy sector has been facing deep changes evolving two different
fronts: (i) the privatization of state owned electric companies (nuclear generation
and power transmission were not included); and (ii) the restructuring of electric
sector as a whole (deregulation). The government has decided to focus the role
of the state on policy-making and market regulation, phasing out its previous
involvement as owner of the major economic agents.
The main objectives of the national energy policy are orientated to: (i) conservation
and efficient use of energy, (ii) expansion of oil production and electric power
supply, (iii) realistic pricing policy, (iv) efficiency of energy production
systems, (v) private enterprise participation, (vi) use of renewable energy
resources; and (vii) technical innovation. Further comments on energy policy
will follow in section 1.3.
1.3 The Electricity System
General description
Up to early 1960's, the Brazilian electric utilities had no central co-ordination. Operation and planning activities were limited to independent utility requirements, resulting isolated or poorly integrated systems. Rapid growth in industrialization led to an inter-regional integration creating expansion opportunities for the electric companies outside their geographical areas. This integration gave rise to increased supply reliability and provided great benefits due to economy of scale.
In 1962, federal government established a holding company, ELETROBRAS, with
the objectives of organizing, co-ordinating and planning all activities of the
sector at the national level. ELETROBRAS is attached to the Ministry of Mines
and Energy. ELETROBRAS is an open corporation with shares negotiated in the
capital market. It co-ordinates the whole electricity sector concerning the
technical, financial and administrative aspects. ELETROBRAS is the major shareholder
of the federal companies and is a minor shareholder in the state-owned companies.
ELETROBRAS is also the main shareholder of ELETRONUCLEAR, the Brazilian nuclear
utility.
A large utility company, ITAIPU Binational, was founded in 1973 by Brazil and Paraguay to manage the ITAIPU hydropower plant of 12,600 MW capacity located at the border of both countries. Due to the difference in the frequencies used in both countries, the energy share sent to Brazil has to be transformed in direct current, transmitted to a conversion unit and then reconverted to 60 Hz alternate current.
As of December 1996, the Brazilian electricity sector comprises 62 organizations:
4 companies of the ELETROBRÁS System (ELETRONORTE, CHESF, FURNAS and
ELETROSUL), 27 state utilities associated to ELETROBRÁS and 31 public
and private utilities (Table 2). The federal government is responsible for electricity
generation in the north and northeast regions through two federal monopolies:
ELETRONORTE and CHESF. In the remaining regions, the ELETROBRÁS System
competes in the generation activities with state-owned utilities. The most important
of these state-owned companies are Companhia Energética de Minas Gerais
(CEMIG) in the Minas Gerais State; Companhia Energética de São
Paulo (CESP) in São Paulo; Companhia Paranaense de Eletricidade (COPEL)
in Paraná and Companhia Estadual de Energia Elétrica (CEEE) in
Rio Grande do Sul. Four vertically integrated state-owned utilities are responsible
for 30% of the available energy. During year 2002, four regional generation/transmission
subsidiaries of ELETROBRÁS accounted for 40.5% of the available energy.
During the second half of the 90's, the government launched a privatization program for the generation and distribution sectors of the electric power system aiming to gather funds to reduce public debts and at same time decreasing the presence of state in activities where private enterprise can be more efficient. There were 35 state and municipal distribution companies/utilities responsible for distribution under public service concessions, covering all 26 states and the Federal District of the country. Today, 80% of these previously state-owned distribution companies are owned by the private sector due to this privatization program.
Following an auction in 1999, the control of the generating company Centrais Elétricas Geradoras do Sul S.A.(Gerasul) was sold. In February 1999, shares of Eletricidade e Serviços S.A. (Elektro) were offered to the public. This company resulted from the separation of the distribution part of CESP. Enron International, the controlling stockholder in Elektro, purchased the shares. Controlling stakes in the generation companies, resulting from the separation of Companhia Energética de São Paulo (CESP), Paranapanema and Tietê, were also sold. In 1999, the U.S. Duke Energy Corporation acquired the company Cia. de Geração de Energia Elétrica Paranapanema and the U.S. company AES (Applied Energy Services, Inc.) acquired the company Cia. de Geração de Energia Elétrica Tietê.
Electricity generation and transmission have been operated by ELETROBRAS subsidiaries, which have been partly privatized and some of the state-owned utilities within the geographical limits of the states. The states have a mix of state and privately owned companies for the distribution of electricity. The exception is the state of Tocantins, recently founded, where electricity is supplied by a private utility. The national electrical transmission grid has 61,539 km of 230 kV lines and 91,000 km of lines lower than 230 and higher than 34 kV.
Due to several reasons, the privatization process has been slowed down after
year 2000 and some of the large state-owned utilities are no longer in the privatization
process. About 75% of the generating capacity in the country is still government
owned.
TABLE 2. PRIVATE AND STATE-OWNED ELECTRICITY GENERATION COMPANIES
|
COMPANY
TYPE |
PARTICIPATION (%) 1996 |
PARTICIPATION (%) 1998 |
PARTICIPATION (%) 2002 |
|
ELETROBRÁS
system |
40.0 |
38.0 |
40.5 |
|
State-owned
Utilities |
36.0 |
34.0 |
31.3 |
|
ITAIPU
- Brazils share |
9.5 |
9.5 |
9.6 |
|
ITAIPU
- Brazils import |
9.5 |
9.5 |
9.6 |
|
Auto-Producers |
4.7 |
5.7 |
4.1 |
|
Private/Municipal |
0.3 |
3.3 |
4.9 |
Source: ELETROBRÁS 2002
Electricity generation and consumption
Brazilian electric system presents as its main peculiarities a large extension of transmission lines and an electricity generation system predominantly hydraulic. Consumer market (47.3 millions of units) is concentrated in the more industrialized South and Southeast regions of the country. North region is supplied mainly by small generating plants, the majority being thermoelectric (oil).
Tables 3 and 4 show the more relevant data concerning Brazilian electricity production and installed capacity. Electricity output in 2002 amounted to 363.14 TWh - 85.4% originated from hydroelectric sources, 10.8% from fossil fuelled plants and 3.8% from nuclear plants. In 2002, the electricity production/energy production rate was about 42%. Electricity consumption per capita increased from 1,653 kWh in 1990 to 2,235 kWh in 2002 and the nuclear energy share over the total electricity production increased from 1% to 4% during the same period.
During the last decade, residential, rural and commercial electricity consumption
has had an expressive increase, however the industrial segment experienced a
much lower growth mainly due to the use of more efficient technologies and rationalization
measures imposed to the use of electricity.
TABLE 3.ELECTRICITY PRODUCTION AND INSTALLED CAPACITY
|
|
|
|
|
|
|
|
Average annual |
|
|
|
|
|
|
|
|
|
growth rate (%) |
|
|
|
|
|
|
|
|
|
1970 |
1990 |
|
|
1970 |
1980 |
1990 |
2000 |
2001 |
2002 |
To |
To |
|
|
|
|
|
|
|
|
1990 |
2002 |
|
|
|
|
|
|
|
|
|
|
|
Electricity production (TWh) |
|
|
|
|
|
|
|
|
|
- Total (1) |
45.46 |
139.49 |
222.82 |
349.15 |
359.40 |
363.14 |
8.27 |
4.15 |
|
- Thermal |
5.60 |
10.58 |
14.06 |
38.42 |
38.72 |
39.14 |
4.71 |
8.91 |
|
- Hydro |
39.86 |
128.91 |
206.71 |
304.69 |
306.33 |
310.17 |
8.58 |
3.44 |
|
- Nuclear |
|
|
2.06 |
6.05 |
14.35 |
13.84 |
|
17.22 |
|
- Geothermal |
|
|
|
|
|
|
|
|
|
Capacity of electrical plants (GWe) |
|
|
|
|
|
|
|
|
|
- Total |
11.23 |
33.37 |
53.05 |
73.06 |
75.14 |
76.74 |
8.07 |
3.12 |
|
- Thermal |
2.41 |
5.87 |
6.87 |
10.40 |
11.51 |
11.98 |
5.39 |
4.75 |
|
- Hydro |
8.83 |
27.50 |
45.56 |
60.76 |
61.73 |
62.86 |
8.55 |
2.72 |
|
- Nuclear |
|
|
0.63 |
1.90 |
1.90 |
1.90 |
|
9.70 |
|
- Geothermal |
|
|
|
|
|
|
|
|
|
- Wind |
|
|
|
|
|
|
|
|
|
|
|
|
|
|
|
|
|
|
|
|
|
|
|
|
|
|
|
|
|
(1) Electricity losses are
not deducted. |
|
|
|
|
|
|
|
|
Source:IAEA Energy and Economic Database.
TABLE 4. ENERGY RELATED RATIOS
|
|
|
|
1970 |
1980 |
1990 |
2000 |
2001 |
2002 |
|
|
|
|
|
|
|
|
|
|
|
Energy consumption per capita (GJ/capita) |
30 |
45 |
47 |
55 |
55 |
55 |
||
|
Electricity per capita (kWh/capita) |
|
457 |
1,124 |
1,653 |
2,229 |
2,165 |
2,235 |
|
|
Electricity production/Energy production (%) |
21 |
38 |
41 |
44 |
43 |
42 |
||
|
Nuclear/Total electricity (%) |
|
|
|
|
1 |
2 |
4 |
4 |
|
Ratio of external dependency (%) (1) |
|
29 |
35 |
22 |
17 |
18 |
35 |
|
|
Load factor of electricity plants |
|
|
|
|
|
|
|
|
|
- Total (%) |
|
|
46 |
48 |
48 |
55 |
55 |
54 |
|
- Thermal |
|
|
27 |
21 |
23 |
42 |
38 |
37 |
|
- Hydro |
|
|
52 |
54 |
52 |
57 |
57 |
56 |
|
- Nuclear |
|
|
|
|
37 |
36 |
84 |
83 |
|
|
|
|
|
|
|
|
|
|
|
|
|
|
|
|
|
|
|
|
|
(1) Net import / Total energy
consumption. |
|
|
|
|
|
|
|
|
Source:IAEA Energy and Economic Database.
Deregulation, open electricity market and decision making process
After 1998, Brazilian government has issued several laws establishing new rules
and measures to ensure competition to be followed by companies operating in
more than one of the electric energy segments: generation, transmission, commercialization
and distribution, assuring to all economical agents open access to transmission
and distribution, through the payment of corresponding economical duties.
According to this institutional organization of the Brazilian electricity sector the following points must be emphasized: (i) the Ministry of Mines and Energy (MME) was maintained as the highest political instance; (ii) the National Electric Power Agency (ANEEL ), created in 1996, replaced the Department of Water and Electrical Energy (DNAEE) as a normative body and (iii) the deterministic energy planning coordinated by ELETROBRAS has been changed to an indicative planning. On May 1998 it was approved a law restructuring ELETROBRAS and its subsidiaries envisioning to increase, through market competition, the efficiency of the generation and commercialization segments of the electrical system.
In 1997 it was created the National Council of Energy Policy - CNPE - an advisory board for the President of the Republic on the formulation of national energy policies.
As a normative and inspection body, ANEEL has among others the following attributions: regulate and control the generation, transmission, distribution and commercialization of electric energy; concession, permission and authorization of installations and services of energy; guarantee fair prices; watch over quality of services; mediate conflicts among electric sector agents; stimulate competition among operators; watch over and assure universalization of access to energy services. The commercialization of the energy generated by ITAIPU Binational and by ANGRA 1 and ANGRA 2 is object of specific regulations.
In order to adapt the Government structure to the new market trends of deregulation, competitiveness and privatization, the National Electric System Operator (ONS), a private organization ruling on utilities, transmission and distribution companies, importers and exporters of power, and power consumers, was also structured on May 1998. ONS has the responsibility to operate, control and co-ordinate the electric energy generation and transmission in the interconnected systems, assuring to the agents of the area a free access to the transmission network and an equanimous treatment, through the use of impartial, predictable and transparent operational rules. The Ministry of Mines and Energy participates on ONS and has veto rights in matters conflicting with national policies. ONS doesn't perform any commercial activity such as selling or buying electric energy.
To complete this process of reorganization of the electric sector, on July 1998, it was created the Wholesale Energy Market ("Mercado Atacadista de Energia - MAE") in order to regulate all transactions of buying and selling of electric energy in all electric interconnected systems, by means of a Market Agreement to be signed by its registered agents. All generators with installed capacity above 50 MW and all distribution/retailers with annual sales in excess of 100 GWh must join the MAE.
Due to many reasons, the implementation of this model has been progressing at a slower pace than originally foreseen and less than 20% of them nave been renegotiated under the new rules. From 2003 on, the new government will review the Whole Sale Market rules to establish a more competitive market and to induce more expansion investments. ELETROBRAS will continue to commercialize the energy from ITAIPU and ELETRONUCLEAR.
2. NUCLEAR POWER SITUATION
2.1. Historical Development and Current Nuclear Power Organizational Structure
2.1.1 Overview
In 1970, a decision was made to build Brazil's first nuclear power station through
an international bid. The contract of a turn-key project for a 626 MW(e) PWR
reactor (ANGRA 1) was awarded to Westinghouse Electric Corporation of the United
States of America. ANGRA 1 construction started in 1971, and the first criticality
was achieved ten years later.
In 1975, in an effort to become self-sufficient in nuclear power generation,
Brazil signed an agreement with the Federal Republic of Germany to build eight
1,300 MW(e) reactors (PWR Biblis B type) over the period of 15 years. Under
this agreement, two of these units (ANGRA 2 and ANGRA 3) were scheduled for
construction on the following year with most of their components imported from
Kraftwerk Union's (KWU) shops in Germany. According to this agreement, the rest
of the plants were to contain 90% Brazilian-made components. The Brazil-Germany
agreement created the Empresas Nucleares Brasileiras (NUCLEBRAS) as the Brazilian
stated-owned nuclear holding company. Additionally, several subsidiaries (joint
companies) were established to achieve nuclear technology transfer from Germany
(see Table 5).
The Brazilian nuclear regulatory body is the National Nuclear Energy Commission (CNEN), responsible for licensing nuclear power plants and nuclear facilities; performing regulatory activities; and training and organizing personnel, according to the Law 4,118 of 1962. In the early 1980's, the Brazilian Navy started a nuclear propulsion programme. The Navy's main activity has been the development of uranium enrichment by using ultracentrifuge process. Success was achieved by the end of the decade, which has continued through the 1990's.
TABLE 5. NUCLEBRAS SUBSIDIARIES
|
COMPANY |
ACTIVITY |
|
NUCLEP* |
Heavy
Components Manufacture |
|
NUCLEI* |
Enrichment
by Jet-Nozzle Process |
|
NUCLEN* |
Nuclear
Power Plant Architect and Engineering |
|
NUCLAM* |
Uranium
Prospection |
|
FEC |
Fuel
Elements Manufacture |
|
CDTN |
Nuclear
Technology R&D Centre |
|
NUCON |
Nuclear
Power Plant Construction |
|
NUCLEMON |
Rare
Earths Production |
|
CIPC |
Mining and Yellow Cake Production |
*Joint Brazilian-German Companies
Due to several factors (especially financial problems) the Brazilian-German technology transfer programme was forestalled. ANGRA 2 and ANGRA 3 construction was interrupted several times, resulting in further delay in Brazilian nuclear programme. Due to Brazil's foreign debt and high inflation with added pressures from privatization programme and budget cuts, the Brazilian nuclear programme was reorganized at the end of the 1980's.
In 1988, a new company, Industrias Nucleares Brasileiras SA (INB) replaced NUCLEBRAS
and its subsidiaries, with limited authority. INB became responsible for rare
earth's, mining of nuclear minerals and yellow cake and nuclear fuel production
assuming FEC, NUCLEMON and CIPC activities. FEC, renamed as Nuclear Complex
of Rezende, was transformed in an INB Directorate. Both INB and NUCLEP, responsible
for heavy equipment fabrication, became CNEN's subsidiaries. However, both companies,
INB and NUCLEP, report directly to the Ministry of Science and Technology and
are administratively independent from CNEN. Responsibility for the construction
of nuclear power stations was transferred to the state-owned utility, FURNAS/ELETROBRAS,
incorporating NUCON activities. NUCLEN was maintained responsible for nuclear
power plant architect and engineering.
In 1997, the architect engineering company NUCLEN, merged with the nuclear directorate of FURNAS, an utility responsible for the bulk supply of electricity of the most developed region of Brazil. The new company named ELETRONUCLEAR - ELETROBRAS Termonuclear S/A. is responsible for design, procurement & follow up of Brazilian and foreign equipment's, management of construction, erection and commissioning of nuclear power plants and is the sole owner and operator of nuclear power plants in the country. Siemens sold its 25% holding in NUCLEN to ELETROBRAS when ELETRONUCLEAR was formed. NUCLEI and NUCLAM were disbanded.
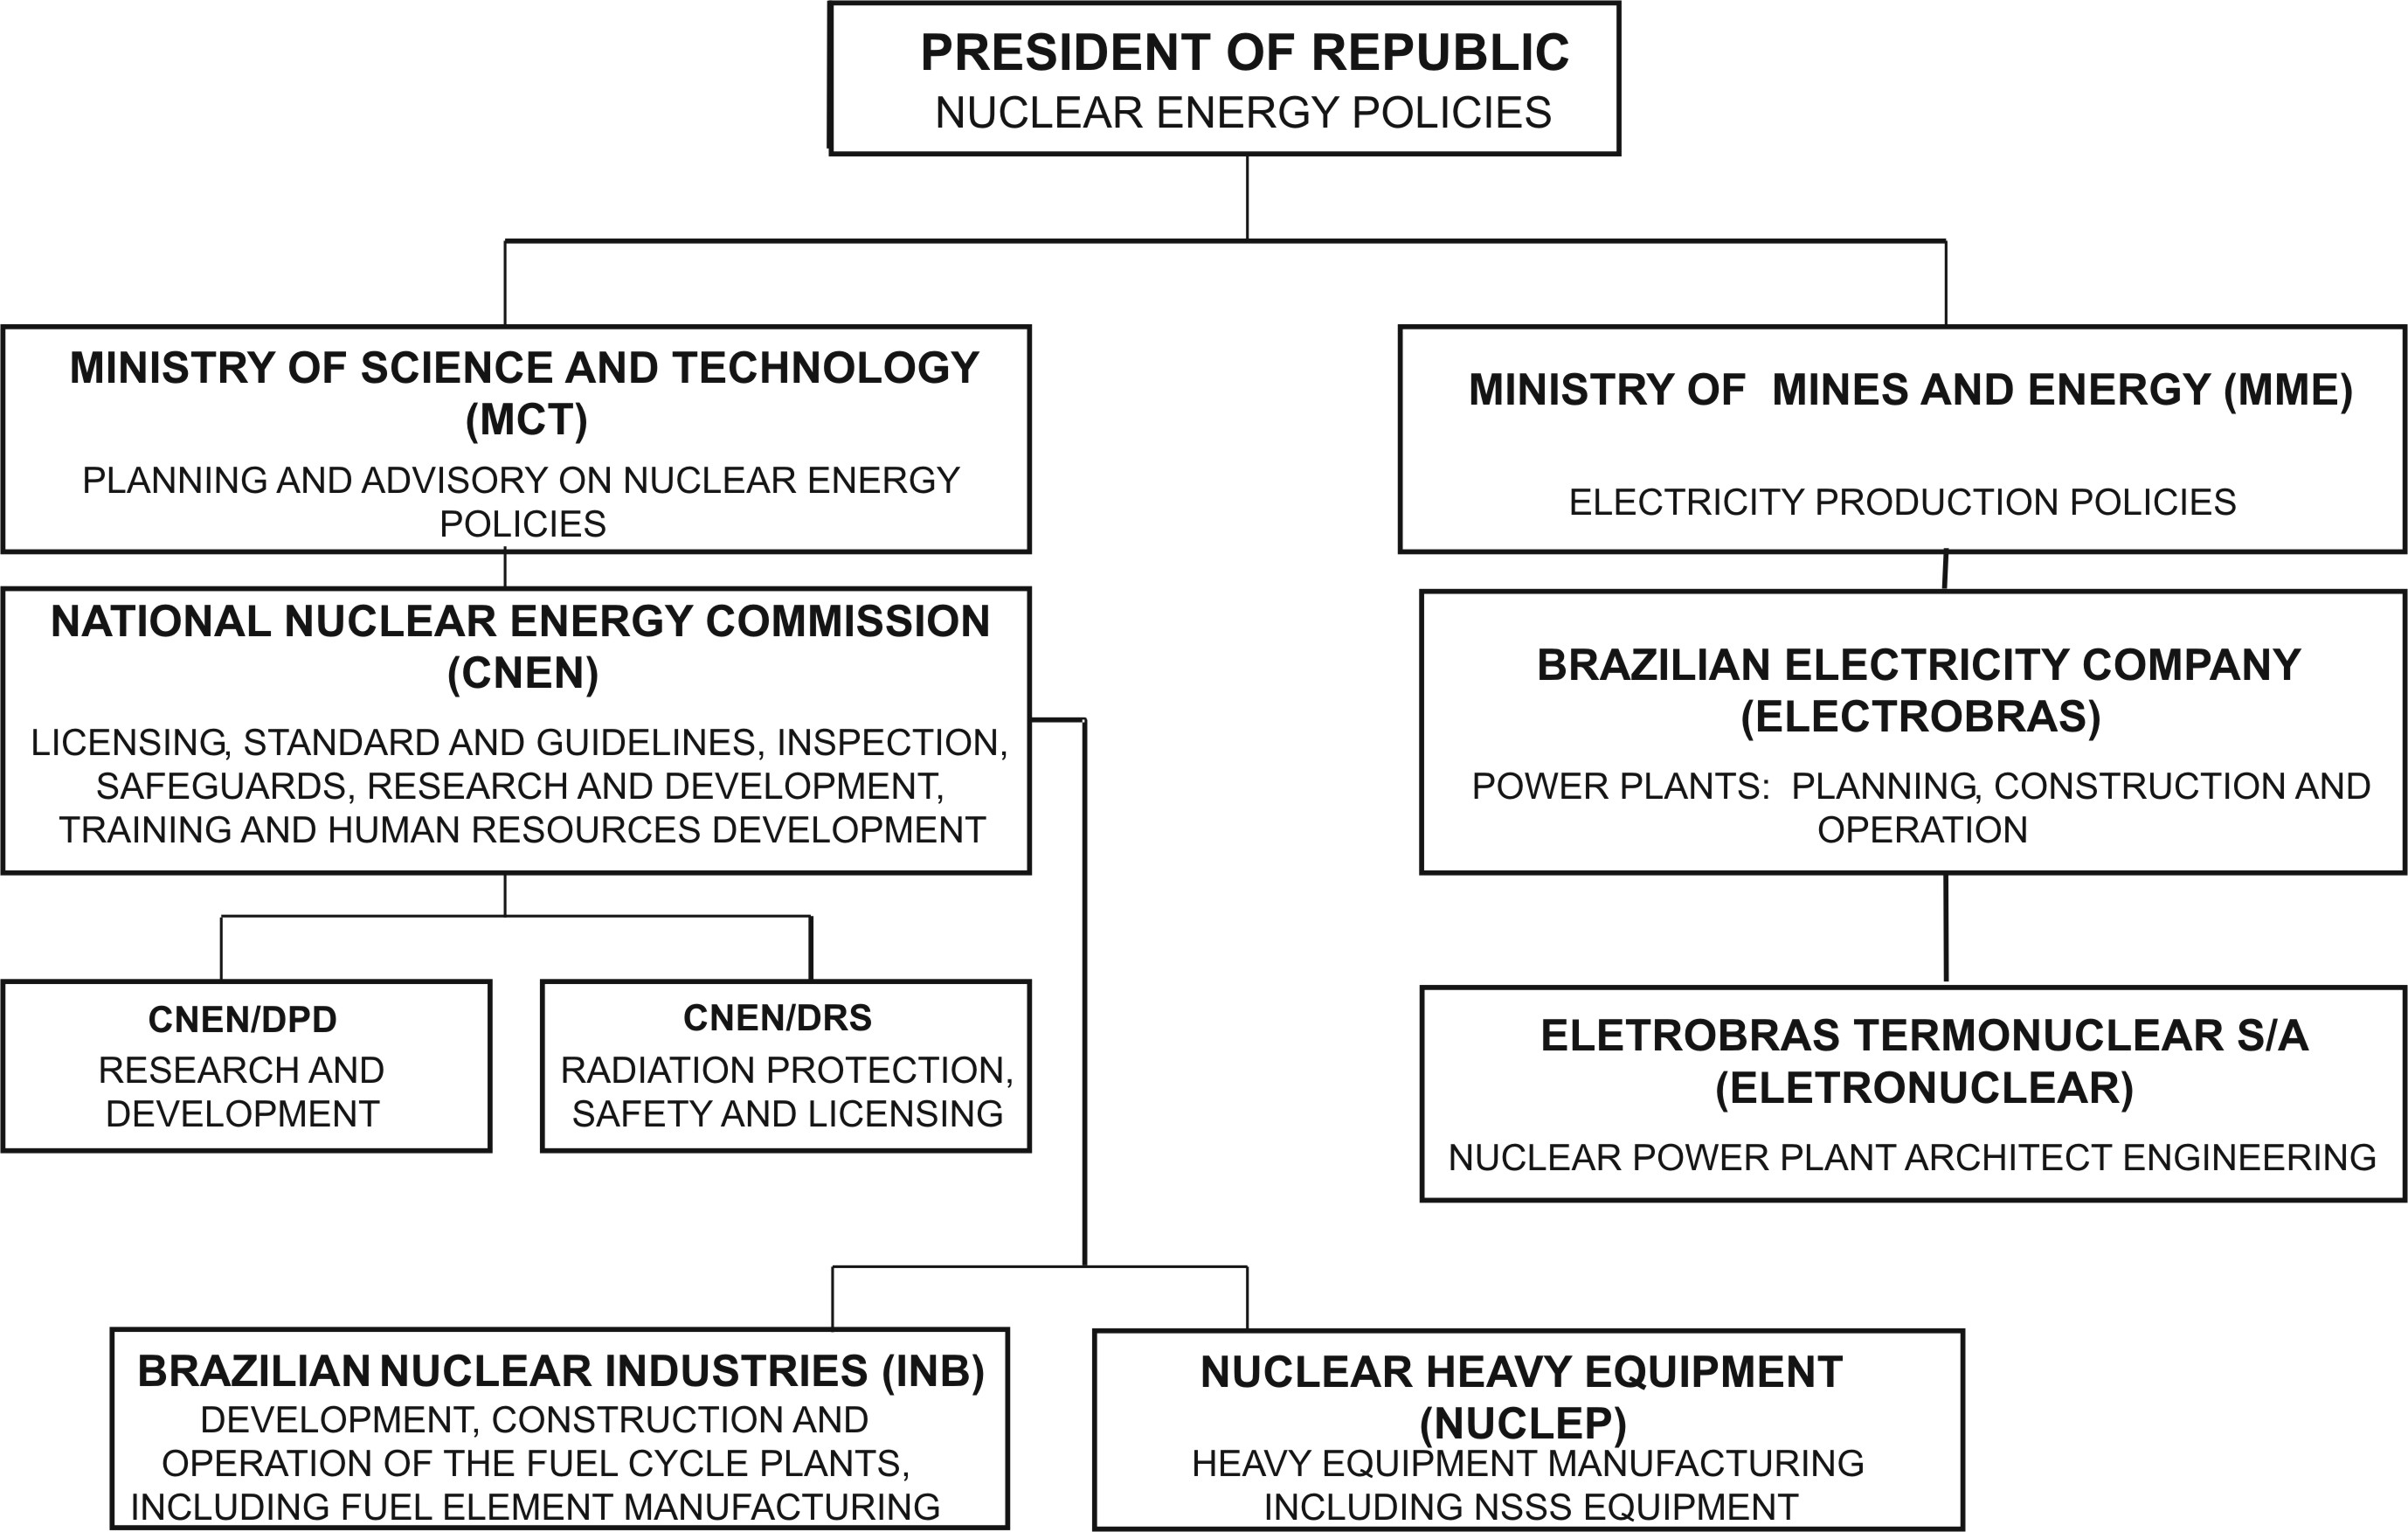
2.1.2. Current Organizational Chart
The organizational structure of Brazil's nuclear sector and the relationships among different organizations are shown in Figure 1. The National Nuclear Energy Commission (CNEN), is the regulatory body, which reports to the Ministry of Science and Technology ( MCT ). The Brazilian Electricity Company (ELETROBRAS), responsible for planning and co-ordinating all activities of the electrical sector at national level, is under the Ministry of Mines and Energy. The remaining organizations are discussed in the following sections.
FIG. 1. Organization Structure for Nuclear Energy Development in Brazil
2.2. Nuclear Power Plants: Status and Operations
2.2.1 Status of Nuclear Power
Hydroelectric power plays a paramount role in the Brazilian electricity system
while thermal power plants (conventional and nuclear) are lower contributors
to national electricity supply. The status of the Brazilian NPPs is shown in
Table 6.
The ANGRA 1 nuclear power plant located between Sao Paulo and Rio de Janeiro,
has a net capacity of 626 MW(e). It started commercial operation in December
1984. During the period of 1985-1989, the plant experienced two unscheduled
outages due to problems on the main condenser and emergency diesel electric
generator.
TABLE 6. STATUS OF NUCLEAR POWER PLANTS
|
Station |
Type |
Net Capacity |
Operator |
Status |
Reactor |
|
|
|
|
|
|
Supplier |
|
ANGRA-1 |
PWR |
626 |
ELETRONU |
Operational |
WESTINGHOUSE |
|
ANGRA-2 |
PWR
|
1270 |
ELETRONU |
Operational |
KWU |
|
ANGRA-3 |
PWR |
1224 |
ELETRONU |
Suspended |
KWU |
|
Station |
Construction |
Criticality |
Grid |
Commercial |
Shutdown |
|
|
Date |
Date |
Date |
Date |
Date |
|
ANGRA-1 |
01-May-71 |
13-Mar-82 |
02-Apr-82 |
01-Dec-84 |
|
|
ANGRA-2 |
01-Jan-76 |
05-Nov-99 |
21-Jul-2000 |
01-Feb-2001 |
|
|
ANGRA-3 |
|
|
|
|
|
Source: IAEA Power Reactor Information System.
Construction of ANGRA 2 nuclear power plant began in January 1976, but due to financial problems the construction of the unit has slowed down and was several times halted. The economic recovery of the second half of the 90's led to the acceleration of the unit's construction. This reactor became critical on July 14, 2000. On July 21st, 2000, at 10:16 pm, ANGRA 2 was synchronized for the first time to the Brazilian interconnected electrical grid. ANGRA 2 trial operation (a test phase of continuous operation at a 100% power level) was successfully completed on December 2000 and, since then, the plant has been operating above 90% of its nominal capacity In July, 2002, the National Electric Power Agency approved the new installed capacity value of 1,350 MW for ANGRA 2.
The third nuclear station (ANGRA 3), a 1,309 MW(e) PWR reactor and similar to ANGRA 2, was acquired to Siemens/KWU together with ANGRA 2. ANGRA 3 has about 70 per cent of the design work completed and 70 per cent of the imported major equipment already manufactured and stored on site. The civil works and electro-mechanical assemblies' activities were postponed in 1991. ELETRONUCLEAR and several independent consulting firms developed technical and economical feasibility studies for ANGRA 3, which were submitted to government authorities. An authorization to re-start the construction works is under consideration at the CNPE (National Council of Energy Policy).
2.2.2 Performance of NPPs
ANGRA 1, since December 1984, has operated at full capacity, in several occasions, when it was necessary. In March 1993, the plant experienced problems with some fuel rods. It resumed energy production in December 1994. From 1994 on, the performance of ANGRA 1 followed a more reliable path, reaching its generation record in 1999, 3,976.9 GWh, with an availability factor of 96%. ANGRA 1 plays an important role in the reliability of the southeast electric system (predominantly of hydro origin) assuring continuous electric power supply to the states of Rio de Janeiro and Espírito Santo where local water resources are virtually exhausted and power supply depends on long transmission lines. In 2002, ANGRA 2 generated 9,238.2 GWh, with an average load factor of 82.7%. The operating experience of ANGRA 1 and 2 is given in Table 7a and 7b.
TABLE 7a. OPERATING EXPERIENCE OF ANGRA 1
|
Year |
Energy GWh |
Average Load Factor (%) |
Year |
Energy GWh |
Average Load Factor (%) |
|
1982 |
54.1 |
0.9 |
1992 |
1752.3 |
30.4 |
|
1983 |
183.7 |
3.2 |
1993 |
441.8 |
7.7 |
|
1984 |
1642.1 |
28.5 |
1994 |
54.9 |
1.0 |
|
1985 |
3412.1 |
59.3 |
1995 |
2520.7 |
43.8 |
|
1986 |
145.6 |
2.5 |
1996 |
2428.9 |
42.1 |
|
1987 |
973.3 |
16.9 |
1997 |
3161.4 |
54.9 |
|
1988 |
613.9 |
10.6 |
1998 |
3265.3 |
56.7 |
|
1989 |
1845.4 |
32.1 |
1999 |
3976.9 |
69.1 |
|
1990 |
2258.0 |
39.2 |
2000 |
3423.3 |
59.3 |
|
1991 |
1441.6 |
25.0 |
2001 |
3853.5 |
67.0 |
|
2002 |
3775.2 |
69.0 |
Source: IAEA Power Reactor Information System (PRIS)
TABLE 7b. OPERATING EXPERIENCE OF ANGRA 2
|
Year |
Energy GWh |
Average Load Factor (%) |
|
2000 |
2421.2 |
- |
|
2001 |
9905.0 |
83.8 |
|
2002 |
9238.2 |
82.7 |
Source: IAEA Power Reactor Information System (PRIS)
2.3 Supply of Nuclear Power Plants
Two companies related to nuclear power plant engineering and component supply are active at the nuclear sector: NUCLEP and ELETRONUCLEAR - ELETROBRAS Termonuclear S/A.
NUCLEP was established to design and fabricate heavy nuclear power plant components, especially those used in the reactor primary circuit. NUCLEP is specialized on fabrication of large components made from alloy steels, nickel alloys and titanium alloys. It maintains modern quality control laboratories, outfitted with precision instruments, qualified and certified according to international standards, for mechanical, chemical and metallurgical testing.
ELETRONUCLEAR is responsible for design, procurement & follow up of Brazilian
and foreign equipment, management of construction, erection and commissioning
of nuclear power plants and is the sole owner and operator of nuclear power
plants in the country.
2.4 Operation of Nuclear Power Plants
ELETRONUCLEAR is the only utility responsible for construction and operation of Brazilian nuclear power plants ANGRA 1 and 2. The ANGRA site has a PWR/ANGRA 2 type simulator in operation since 1985. The simulator has provided operator-training services for utilities from countries such as Spain, Switzerland, Germany and Argentina, which operate nuclear power plants supplied by KWU.
2.5 Fuel Cycle and Waste Management
Indústrias Nucleares do Brasil S.A. - INB, a state company which has
succeed NUCLEBRAS, has as its main goal the implementation of industrial units
related to nuclear fuel cycle for nuclear power plants. Nowadays, there are
in Brazil industrial units for: uranium mining and milling, isotopic enrichment,
reconversion, pellets production and fuel elements assembling. The mineral exploration
program carried out in the last decades resulted in the discovery of new deposits
that projected Brazil to be the sixth geological resources in the world, responsible
for 11% of that total. It should be taken into account that only 25% of the
Brazilian territory has been prospected, which enable us to predict very good
perspectives of increasing those resources, due to favorable geological conditions
Mining and milling
Systematic prospecting and exploration of radioactive minerals in Brazil began
in 1952. The exploration was accelerated by the availability of funds for this
purpose from 1970 onwards. There was active exploration and many occurrences
were identified through the use of geological, geophysical and geochemical surveys,
and related research. From 1974 to 1991 the total amount spent in uranium exploration
was equivalent to US$ 150 million. With changes in nuclear policies and, consequently,
uranium requirements, investments fell sharply. Since 1991, all uranium prospecting
has stopped.
FIG. 2. Brazilian Nuclear Installations
Brazilian uranium resources occur in a number of geological environments and, consequently, belong to several deposit types; some of them hosted in near surface. In addition to known resources, there is a high potential for further discovery of economic uranium deposits. Areas favourable for uranium resources not yet explored covers 50 % of the Brazilian territory.
Brazil has been producing uranium since 1982. Between 1982 and 1995 the cumulative uranium production was 1,030 tU from the Poços de Caldas Unit and 540 tU from the Lagoa Real Unit, the only commercial plant currently in operation, between March 2000 and December 2002. Brazilian short?term uranium production capability is 340 tU/year.
Expansion of milling capacity on Lagoa Real to 670 tU/year has been studied. After the planned expansion of Lagoa Real, INB will concentrate on the development of Itataia deposits. However, since uranium will be a co-product of phosphate, the feasibility of the project depends mainly on the phosphate market. Direct employment in Brazilian uranium industry is raising. Losses caused by closure of the Poços de Caldas Unit were offset by increases associated with beginning operation and planned expansion of Lagoa Real Unit.
The uranium production in Brazil is only for domestic use. All uranium concentrate produced is shipped to other countries for conversion and enrichment and then returned to Brazil for fuel fabrication. One shipment of uranium concentrate was carried out in June 2001, including an amount of 73 tU and four shipments were carried out in 2002 totalling an amount of 466 tU.
Brief information on main uranium sites is given below:
a) Poços de Caldas Site
The Poços de Caldas Site is located at one of the biggest alkaline intrusions in the world. Discovered in 1948; this deposit was developed into an open pit mine. Poços de Caldas Unit started production in 1982 with a design capacity of 425 tU/year.
Since the exploration of the uranium deposit was no longer economically feasible, the Poços de Caldas Unit ceased operations in 1995. After two years of standing by, it was finally shut down in 1997. The closure planning and rehabilitation actions are still under development.
The closure of Poços de Caldas Unit in 1997 brought to an end the exploitation of a low?grade ore deposit, which produced vast amounts of waste rock. Studies for proper decommissioning are being conducted by INB. The operational costs of collecting, pumping, and treating acid drainage were estimated to be US$ 610,000 per year. With the end of the mine exploitation, INB proposed the use of industrial facilities for other projects such as the monazite chemical processing and rare earth production. For these activities, an environmental license adjustment was signed and the licensing process at CNEN is on going.
b) Lagoa Real Site (Caetité Unit)
Lagoa Real is currently the only operating uranium site in Brazil. The deposits were discovered in 1977 and its known resources were estimated to be 85,000 tU at the below US$ 80/KgU cost category averaging 0.30% U3O8. There are 35 occurrences detected, 12 of which were considered uranium ore deposits. Cachoeira deposit is mined by open pit methods. Surface acid heap leaching methods are used. Plant has a design capacity to produce 300 t/year of U3O8 and there are plans for expansion.
Mining activities, decommissioning planning, and area rehabilitation are done simultaneously. Monitoring programs are implemented to demonstrate compliance with regulatory requirements. As part of the regulatory licensing process, INB has done an independent hydrogeological assessment of the local aquifer.
Feasibility studies for Lagoa Real Unit expansion have been carried out. The expansion will increase annual production capacity to 670 tU, which will double current production levels. The cost of expansion is estimated to be US$ 3.5 million.
c) Itataia Site
Discovered in 1976, Itataia deposits account for almost 50% of the total known low cost resources in Brazil. A radiometric aerial survey identified 273 anomalies on the project area. The deposit is suitable for open pit mining with uranium recovery estimated at 70%.
In the planned Itataia Unit, uranium would be recovered as a co-product of phosphate from apatite and collophanite bearing episyenites. The U3O8 grade varies from 500 to 9,000 ppm and the P2O5 grade from 12% to 37%. Development of the uranium-phosphate Itataia project will depend on numerous factors, including the markets for both products. A production start up date has not yet been set. Annual production capability is projected to be 250 tU.
Conversion
As part of Brazilian Navy nuclear propulsion programme, a UF6 pilot plant with a nominal production capacity of 40 tU/year is under construction at the Navy Research Institute (CTMSP), located in Iperó (100 Km from São Paulo). There are no plans to install a commercial plant in the near future.
Enrichment
As part of its nuclear propulsion programme, the Brazilian Navy installed in Iperó a demonstration enrichment centrifuge pilot plant. Recently the Brazilian Government decided to start the industrial implementation of the ultracentrifuge process developed by CTMSP in the Resende Industrial Plant in the state of Rio de Janeiro. It is expected the first unit to start operation by end-2003. The complete set of units is intended to be operating in eight years, to attend the ANGRA 1 needs and partially the needs of ANGRA 2 and 3 (~300,000 SWU/year). A future increase of this capacity will depend on technical evaluation and resources availability.
Fabrication
The Nuclear Fuel Factory (FCN) is located at Resende, state of Rio de Janeiro, comprising three units, and has a production capacity of 280 tons of uranium per year. At present, FCN was modernized and produces at the Components and Assembly Unit the fuel rods and fuel elements needed for Brazilian nuclear reactors. The Reconversion and Pellets Production Unit is operating since 1999 with a capacity of 160 tons of UO2 pellets/year. The UO2 reconversion line uses the AUC process. The Nuclear Fuel Factory also produces other fuel element components, such as top and bottom nozzles, spacer grids and end plugs for export demands.
Waste management
The major sources of radioactive waste producers in Brazil are the two nuclear
power plants. The waste generated by the uranium mining and milling industrial
complex, although significant in volume, is kept at the site, in a dam specially
built for this purpose. The waste management policy takes into account both
the accumulated and projected waste generated by the above mentioned facilities
and the existing 3,500 cubic meters of Caesium-137 waste produced as a result
of the decontamination work performed in Goiânia, following the 1987 accident
that involved a 1,375 Curies teletherapy source.
The National Nuclear Energy Commission, CNEN, is responsible for regulation
and final disposal of radioactive waste. Political aspects related to the subject
of radioactive waste disposal contribute to the difficulties faced by the Brazilian
Government when decisions concerning radioactive waste management are to be
taken. Concerning national legislation, Law 10,308 enacted on November 20, 2001,
establishes rules for radioactive waste deposits site selection, construction,
licensing, operation, control, compensation, civil responsibilities and warranties.
The waste generated by the uranium mining and milling industrial complex, located
at the Poços de Caldas plateau in the Brazilian state of Minas Gerais,
is kept in a 29.2 hectares dam system, specially built for that purpose. In
the waste dam a total of 2.0x10⁶ tons of solid material are estocked.
Because the Brazilian reprocessing programme has not been defined, the ANGRA
1 spent fuel is temporally stored on-site, in the reactor basin. As of December
2000, 180,9 metric tons of spent fuel (506 fuel elements) are stored in racks
at the on-site reactor basin of ANGRA 1 nuclear power plant. A new compact storage
rack was installed in ANGRA 1, in 2002, with a planned capacity of 1,252 fuel
assemblies, increasing the storage capacity of the on-site reactor basin.
2.6 Research and Development
2.6.1 R&D Organizations and Institutes
The National Nuclear Energy Commission (CNEN), created in 1956, has the mission to promote, orient and co-ordinate research and development in all areas related to peaceful uses of nuclear energy. CNEN comprises three directorates whose responsibilities are:
i) Directorate of Institutional Management (DGI): human resources, administration
and information management, financial reporting and control;
ii) Directorate of Research and Development (DPD): fuel cycle and materials;
reactor technology; radiation utilization and radioisotopes application in health,
industry, agriculture and environment; radioisotopes and radiopharmaceuticals
production; instrumentation & control and man-machine interface; nuclear
safety; nuclear physics and chemistry, etc.;
iii) Directorate of Radiation Protection and Safety (DRS): Radiation protection,
safety, control and licensing of nuclear power plants and other nuclear and
radioactive installations.
During the last decades, five research nuclear centres have been established
for carrying out R&D in nuclear sciences and engineering. Research reactors,
accelerators and various R&D laboratories, including pilot plant facilities,
were progressively set up in these centres. These five research centres are:
IPEN (São Paulo/SP) - Institute for Energy and Nuclear Research
- Research Reactors: 2 (one 5 MW/pool type and one zero power reactor/tank type)
- Cyclotron
- Radioisotopes Production (99mTc; 131I; 121I; etc.)
- Research on fuel cycle and materials; reactor technology; safety; fundamentals;
radiation and radioisotope applications; biotechnology; environmental and waste
technology.
IEN (Rio de Janeiro/RJ) - Institute for Nuclear Engineering
- Research Reactor: 1 (100 kW, ARGONAUTA)
- Cyclotron
- Radioisotopes production
- Research on instrumentation, control and man-machine interfaces; chemistry
and materials; safety; reactor technology .
CDTN (Belo Horizonte/MG) - Centre for Nuclear Technology Development
- Research Reactor: 1 (250 kW, TRIGA)
- Research on mining; reactor technology; materials, safety; chemistry; environmental
and waste technology.
IRD (Rio de Janeiro/RJ) - Institute for Radiation Protection and Dosimetry
- Research on radiation protection and safety; environmental technology; metrology;
medical physics.
CRCN (Recife/PE) - Nuclear Sciences Regional Centre
- Research on radiation protection, dosimetry and metrology.
2.6.2 Development of Advanced and New Generation Nuclear Reactor Systems
Brazil has been participating on the Generation IV International Forum since
its beginning and has had an active participation until the conclusion of the
road map. From that point on it wasn't made yet a firm commitment concerning
the diversity and reach of the involvement of the Brazilian institutions. Also
our country has had a relevant involvement in the IAEA INPRO initiative, being
member of the Steering Committee and taking part in some of its working groups.
The country is also taking part on the IRIS (International Reactor Innovative and Secure) program. IRIS is a small-to-medium power (335 MWe) integral type pressurized water reactor which has the significant characteristics of simplicity, enhanced safety, improved economics, proliferation resistance and waste minimization. The research institutes of CNEN are participating in specific design activities and some matching research. A decision is still pending concerning the strengthening of the Brazilian participation on the project in the future.
2.7 International Co-operation and Initiatives
Under the sponsorship of International Atomic Energy Agency, Brazil has been
participating in many technical assistance programs, advisory groups and symposium
meetings. As shown in ANNEX, Brazil has several technical co-operation agreements
with many countries to exchange information on the various fields of peaceful
uses of nuclear energy such as, reactors technology, materials, nuclear applications
in industry, health and environment, nuclear safety and radiological protection,
computer codes development and assessment, training, radioactive waste management
and radioactive materials transportation.
2.8 Human resources development
The National Nuclear Energy Commission - CNEN - and its five research institutes
have more than 2,500 technicians working directly on nuclear R&D and some
other 1,200 professionals hold jobs on nuclear industries of the power generation
and fuel cycle. R&D staff of the National Nuclear Energy Commission is specially
of high qualified education with half of them holding university degree and
from these 26% are PhDs and 34% MScs.
Four of CNEN's main institutes (IPEN, CDTN, IEN and IRD) are responsible for Master and Doctorate courses in nuclear technology areas in association with universities. The Instituto de Pesquisas Energeticas e Nucleares, IPEN, is responsible for the older and bigger post graduation course in nuclear and related technologies in the country, in association with the University of São Paulo. This course has around 350 students per year, graduating around 60 Doctors and Master every year.
3. NATIONAL LAWS AND REGULATIONS
3.1. Safety Authority and the Licensing Process
The governmental organization responsible for the licensing of nuclear power
plants (NPPs) and other nuclear installations in Brazil is the National Nuclear
Energy Commission (CNEN). In August 1962, with the enactment of Law No. 4,118,
a National Policy on Nuclear Energy was established with the Government monopoly
of nuclear materials and nuclear minerals.
In the early 1970's, due to the needs of the Brazilian Nuclear Power Programme, nuclear safety standards started to be used. An extensive set of rules and standards, as listed under section 3.2, regulate the nuclear activities in Brazil. CNEN regulatory staff amounts to more than 300 qualified professionals. The regulatory process involves the issuance of five licenses or authorizations as listed below:
· Site Approval;
· Construction Permit;
· Nuclear Material Utilization Authorization;
· Initial Operation Authorization; and,
· Permanent Operation Authorization.
Standard CNEN-NE-1.04 establishes the requirements for the licensing process of nuclear installations. The Initial Operation Authorization is issued after safety analysis approval and for a limited period of time to fulfil other minor information with operational experience. The Permanent Operation Authorization is limited to 40 years. A Periodic Safety Reassessment is conducted every ten years of operation, when the conditions of authorization can be modified or extended. A programme of inspections and audits is implemented and regular meetings with operators are held.
In January 1999 a law establishing fees and taxes for license and operating authorization was approved by the National Congress and signed by the President of Brazil (Law 9,765/99). It establishes the fees for a NPP operating license as well as annual fees for operating units. These fees are directed to a special account to be used by CNEN in its licensing and inspection activities.
In 1981, the Environmental Policy Law was promulgated and, from 1983 to 1989,
CNEN was also responsible for conducting the environmental licensing of nuclear
installations. In 1989, the Brazilian Institute of Environment (IBAMA) was created
and designated to conduct the environmental licensing of all installations,
including nuclear facilities. CNEN is the co-authority on radiation aspects
related to environmental licensing of nuclear facilities. This co-authority
role means that a CNEN assessment and review has to be considered in the final
decision by IBAMA. These organisations elaborate regulations according to its
attributions and fields of competence and follow their implementation.
During the operational phase of nuclear facilities periodic safety reports
are required. Regulatory safety assessment is conducted by CNEN through the
review of the licensee's reports as well as through periodic inspections. On-site
resident inspectors are assigned for permanent supervision of operational safety.
Concerning public communication, CNEN listen to public concerns and makes available information and standards through internet, distributes printed material, responds to e-mails and participates in professional associations exhibits, meeting and events. CNEN is permanently open for interviews with the media. CNEN participates also in public hearings and meetings whenever invited. Public representatives such as parliamentarians and officers of the Public Prosecutor's Office receive timely and factual answers to all questions.
3.2. Main National Laws and Regulations
The Brazilian National Congress approves the main legislation related to nuclear
activities. CNEN's regulations and standards are based on IAEA standards, commonly
used by many nations. The main laws and standards used in Brazil are:
· Law No. 4,118: National Policy on Nuclear Energy, 1962.
· Law No. 6,189: CNEN's Set-up as Regulatory and Licensing Federal Authority,
1974.
· Law No. 2,464: Nuclear Sector Reorganization, 1988.
· Law No. 7,781: Revision of Law No. 6,189, 1989.
· Law No. 9,765: Licensing, control and inspection tax for nuclear and
radioactive materials and utilities, 1999
CNEN's main standards are available at www.cnen.gov.br. Among these standards,
the following can be mentioned:
· CNEN-NE.1.04: Licensing of Nuclear Installations, 1984.
· CNEN-NN.1.16: Quality Assurance for Nuclear Power Plants, 1999.
· CNEN-NE.1.01: Licensing of Nuclear Reactors Operators, 1979.
· CNEN-NN.1.12: Qualification of Independent Technical Supervisory Organisation,
1981.
· CNEN-NE.1.13: Licensing of Uranium and Thorium Mining and Milling Facilities,
1989.
· CNEN-NE.1.14: Operating Reports of Nuclear Power Plants, 1983.
· CNEN-NN.1.15: Independent Technical Supervisory in Quality Assurance
Activities for Nuclear Power Plant, 1983.
· CNEN.NE.2.01: Physical Protection of Operational Units of Nuclear Installations,
1981.
· CNEN-NN.2.02: Nuclear Material Control and Safeguards, 1999.
· CNEN-NE.2.03: Fire Protection in Nuclear Power Plants, 1988.
· CNEN-NE.2.04: Fire Protection in Fuel Cycle Nuclear Installations,
1997.
· CNEN-NE.3.01: Basic Guidelines for Radiological Protection, 1988 (under
revision).
· CNEN-NE.3.02: Radiation Protection Units, 1988.
· CNEN-NN.3.03: Competence Accreditation of Radiation Protection Officers,
1999.
· CNEN-NE.5.02: Transport Storage and Handling of Nuclear Fuels, 1989.
4. CURRENT ISSUES AND DEVELOPMENTS ON NUCLEAR POWER
4.1 Energy Policy
Hydroelectric power plays a paramount role in the Brazilian electricity system while thermal power plants (conventional and nuclear) are meagre contributors to electricity supply. Considering the country's huge hydroelectric potential along with social and economical uncertainties, it is very difficult to forecast further nuclear power development in Brazil. However, according to the "Plan 2015" (i.e. ELETROBRÁS' National Plan for Electrical Sector Expansion to 2015), an additional nuclear capacity of 1,300 MW(e) was planned for 2001 (commissioning of Angra 2). The construction of the ANGRA 3 power station is being studied.
4.2 Privatisation and deregulation
The Brazilian electric sector is facing a restructuring that comprises the following institutional aspects (i) the creation of the Wholesale Energy Market (WEM), with the definition of new agents, their relationships, commercialization rules at the supply level and measures to ensure competition to be followed by companies operating in more than one of these segments: generation, transmission, commercialization and distribution. All generators with installed capacity above 50 MW and all distribution/ retailers with annual sales in excess of 100 GW·h would be required to join the WEM. Free consumers would be entitled to join. Large consumers over 10 MW are free to choose their suppliers;
REFERENCES
[1] IAEA Energy and Economic Data Base, (EEDB).
[2] IAEA Power Reactor Information System (PRIS).
[3] Brazilian Institute for Geography and Statistics, www.ibge.gov.br.
Appendix 1.
International, Multilateral and Bilateral Agreements
AGREEMENTS WITH THE
IAEA
|
||
|
Signature: |
26
October 1956 |
|
Acceptance
of amendment of Article VI |
01 June 1973 |
|
Entry
into force: |
13 June 1966 |
|
Entry into force: |
4 March 1994 |
|
Not signed |
|
|
|
|
|
|
Suspension signed: |
16 October 1998 |
|
|
|
|
|
Entry into force: |
31 October 1968 |
|
|
|
|
|
Signature: |
27 July 1972 |
|
Entry
into force: |
27 February 1991 |
|
Entry
into force: |
September
1984 |
|
Signed: |
4
August 1999 |
|
|
||
|
MAIN INTERNATIONAL
TREATIES |
||
|
Entry
into force: |
18 September 1998 |
|
Signed: |
29 January 1968 |
|
Ratified: |
30
May 1994 |
|
Entry
into force: |
8 February 1987 |
|
Entry into force: |
4 January 1991 |
|
Entry into force: |
4 January 1991 |
|
Entry into force: |
26 June 1993 |
|
Not applicable |
|
|
Non-Party |
|
|
Not signed |
|
|
Not signed |
|
|
Entry
into force: |
2
June 1997 |
|
Signature: |
31 October 1997 |
|
|
||
OTHER
RELEVANT INTERNATIONAL TREATIES
|
||
|
Non-member |
|
|
·
Improved procedures for designation of safeguards
inspectors |
Not accepted |
|
|
Member |
|
|
Adopted |
|
|
Signature: |
5 August 1963 |
|
Entry into force: |
15
December 1964 |
|
Signature: |
7 April 1964 |
|
Signature: |
29 December 1964 |
|
Signature: |
3 September 1971 |
|
Signature: |
17 December 1971 |
|
Signature: |
29 December 1972 |
|
Signature: |
16 June 1992 |
|
|
||
MULTILATERAL AGREEMENTS
|
||
|
Signature: |
1
December 1959 |
|
|
||
|
BILATERAL AGREEMENTS: |
||
|
Paraguay |
18 August 1961 |
|
Bolivia |
11 January 1966 |
|
Ecuador |
11 June 1970 |
|
Germany |
7 June 1972 |
|
Germany |
27 June 1975 |
|
Germany |
8 March 1978 |
|
Germany |
8 March 1978 |
|
France |
6 January 1981 |
|
Colombia |
12 March 1981 |
|
Peru |
26 June 1981 |
|
Italy |
29 July 1981 |
|
Great Britain |
2
December 1981 |
|
Spain |
12 May 1983 |
|
Venezuela |
30 November 1983 |
|
USA |
6
February 1984 |
|
China |
29 May 1984 |
|
China |
11 October 1984 |
|
Argentina |
18 July 1986 |
|
Argentina |
18 July 1991 |
|
Argentina |
13
December 1991 |
|
ABACC |
27 March 1992 |
|
Russian
Federation |
15 September 1994 |
|
·
Agreement concerning peaceful uses of nuclear
energy |
USA |
14 October 1997
|
|
·
Accord de coopération scientifique et technique
dans le domaine de lutilisation pacifique de lenergie nucléaire |
France |
25 October 2002 |
|
USA |
20 June 2003 |
Appendix 2.
DIRECTORY OF THE MAIN ORGANIZATIONS, INSTITUTIONS AND COMPANIES INVOLVED IN NUCLEAR POWER RELATED ACTIVITIES
NATIONAL
ATOMIC ENERGY AUTHORITY
|
||
|
Comissão
Nacional de Energia Nuclear (CNEN) |
Tel: (5521) 2295 9596 |
|
|
Rua
General Severiano 90, BOTAFOGO |
Fax: (5521) 2541 8897 |
|
|
22290-901
- Rio de Janeiro-RJ, Brazil |
||
NATIONAL NUCLEAR ENERGY COMMISSION
INSTITUTES
|
||
|
Centro de Desenvolvimento
da Tecnologia Nuclear (CDTN) |
Tel.: (5531) 3499 3261 |
|
|
Rua Prof. Mário Werneck,
S/No, Cidade Universitária |
Fax: (5531) 3499 3440 |
|
|
30161-970 - Belo Horizonte-MG,
Brazil |
||
|
|
|
|
|
Instituto de Engenharia
Nuclear (IEN) |
Tel.: (5521) 2209 8052 |
|
|
Av. Brig. Trompowiski,
s/n |
Fax: (5521) 2590 2692 |
|
|
Cidade Universitária Ilha
do Fundão |
||
|
21945-970 - Rio de Janeiro-RJ,
Brazil |
|
|
|
|
|
|
|
Instituto de Pesquisas
Energéticas e Nucleares (IPEN) |
Tel.: (5511) 3816 9100 |
|
|
Av. Prof. Lineu Prestes,
2242 |
Fax: (5511) 3812 3546 |
|
|
Cidade Univesitária - Pinheiros |
||
|
05508-000 - São Paulo
SP, Brazil |
|
|
|
|
|
|
|
Instituto de Radioproteção
e Dosimetria (IRD) |
Tel.: (5521) 2442 1927 |
|
|
Av. Salvador Allende, S/No,
Barra da Tijuca |
Fax: (5521) 2442 1950 |
|
|
22780-160 - Rio de Janeiro
RJ, Brazil |
||
|
|
|
|
Centro Regional de Ciências Nucleares (CRCN)
|
Tel.: (5581) 34417168
|
|
|
R. Cônego Barata, 999 Tamarineira |
Fax: (5581) 34417196 |
|
|
51200-010 Recife-PE, Brazil |
||
OTHER NUCLEAR ORGANIZATIONS
|
||
|
Indústrias Nucleares do
Brasil (INB) |
Tel.: (5521) 2552 1845 |
|
|
Rua mena Barreto, 161 - Botafogo |
Fax: (5521) 2286 8261 |
|
|
22271-100 - Rio de Janeiro-RJ,
Brazil |
||
|
|
|
|
|
Eletrobrás Termonuclear
S/A (ELETRONUCLEAR) |
Tel.: (5521) 2588 7000 |
|
|
Rua da Candelária 65 |
Fax: (5521) 2588 7200 |
|
|
20091-020 - Rio de Janeiro
RJ, Brazil |
||
|
|
|
|
|
Nuclebrás Equipamentos
Pesados S/A (NUCLEP) |
Tel.: (5521) 2688 2056 |
|
|
Av. Gal. Euclides de Oliveira
Figueiredo, 200 - Itaguaí |
Fax: (5521) 2688 3011 |
|
|
23825-410 - Rio de Janeiro-RJ,
Brazil |
||
|
|
|
|
|
Agência Brasileiro-Argentina
de Contabilidade e Controle |
Tel: (5521) 2221 3464 |
|
|
de Materiais Nucleares
(ABACC) |
Fax: (5521) 2507 1857 |
|
|
Av. Rio Branco, 123 5º andar Centro |
||
|
20040-005 Rio de Janeiro-RJ,
Brazil |
|
|
|
|
|
|
|
Associação Brasileira de
Energia Nuclear (ABEN) |
Tel: (5521) 2536 1751/1869 |
|
|
Rua Mena Barreto, 161 -
Botafogo |
Fax: (5521) 2286 6646 |
|
|
2271-100 Rio de Janeiro-RJ,
Brazil |
||
|
|
|
|
|
Centro de Energia Nuclear
na Agricultura (CENA) |
Tel: (5519) 3429 4600 |
|
|
Av. Centenário, 303 |
Fax: (5519) 3429 4610 |
|
|
13400-961 Piracicaba-SP,
Brazil |
||
|
|
|
|