FIG. 2. Map of the Republic of Armenia
ARMENIA
1. GENERAL ENERGY, ECONOMIC AND ELECTRICITY INFORMATION
1.1 General Overview
The Republic of Armenia, the smallest of the three Transcaucasian republics,
is a landlocked mountainous country bounded on the north by the Republic of
Georgia, on the east and southwest by Azerbaijan, on the south by Iran and on
the west by Turkey. The northern border is 196 km long, the border with Azerbaijan
is 913 km, the southern border has a length of 42 km and the western 280 km.
The land area of the republic is 28 400 km2. The terrain is defined
by the high Armenian Plateau with mountains, little forest and fast flowing
rivers. The average height above sea level is about 1 800 meters.
FIG. 2. Map of the Republic of Armenia
The climate is highland continental with hot and dry summers and cold winters. Annual average temperature varies from -2.7°C to 13.8°C. The coldest month is January (from 1.2°C to -12.8°C) and the hottest months are July and August (from 25.8°C to 8.7°C). Summer temperatures may rise up to 42°C, winter cold has maximum of 46°C below zero. Summer relative wetness is 32-45% (July-August), winter relative wetness is 80-90%. Annual rainfall varies from 220 mm (in winter) to 900 mm (May- June). The annual maximum sunshine is 2 780 hours (Lake Sevan area), and minimum 1 930 hours (Idgevan). The average intensity of solar radiation on the aclinic plane on a cloudless day is 700 kkal/m2. The annual average wind velocity varies from 7.7 m/sec to 1.0 m/sec.
The population of Armenia, according to the 2001census of population, is about 3.21 million, of which 70% lives in urban areas. Armenia is a densely populated country with a density of 113 person/km2. The historical population information is shown in Table 3.
TABLE 3. POPULATION INFORMATION
|
Growth |
|||||||||||
|
rate (%) |
|||||||||||
|
1979 |
|||||||||||
|
|
1970a |
1979a |
1989a |
1990 |
1998b |
1999b |
2000b |
2000a |
2002 |
to |
|
|
|
|
|
|
|
|
|
|
|
|
2002 |
|
|
Population (millions) |
2.49 |
3.03 |
3.52 |
3.58 |
3.75 |
3.81 |
3.8 |
3.21 |
3.21 |
0.24 |
|
|
Population density (inhabitants/km²) |
88 |
107 |
121 |
126 |
132 |
134 |
134 |
113 |
113 |
0.24 |
|
|
Urban population as percent of total |
59 |
65 |
67 |
67 |
69 |
69 |
70 |
70 |
70 |
1.03 |
|
|
Area (1000 km²) 28.4 |
|
|
|
|
|
||||||
a Formal data of the census of
population. b
Data & Statistics/The World Bank
Source: IAEA Energy and Economic Database; Data & Statistics/The World Bank; Country Information.
The population average growth from 1979 to 2002 is about 0.24% . The concentration of population is not equal in different areas of the republic. The Ararat Valley is the most populated territory of the country with the density of 245 person/km2. Its area makes about 26.7% of the total territory and its population reach to 58.8% of the total population. Yerevan, the capital of the Republic of Armenia, lays in the Ararat Valley and is home to 1.2 million people, which is about one third of the total population. The highland areas have much less population with the density of 35 person/km2.
1.1.1. Economic Indicators
After the disintegration of the Soviet Union, an economic crisis broke out,
and Armenia suffered from sharp decline in production during the period 1990-1994.
The country undertook great efforts to overcome it. Since then, the situation
has been gradually stabilized, and the republic is coming out of the crisis
following the transition to a market economy. During the period 1995-2002, the
Gross Domestic Product (GDP) has increased on 83 %, and the average growth rate
was 9.1 % per year. The historical GDP information is shown in Table 4.
TABLE 4. GROSS DOMESTIC PRODUCT (GDP)
|
Growth |
||||||||||||||
|
rate (%) |
||||||||||||||
|
1990 |
||||||||||||||
|
|
1990 |
1991 |
1992 |
1993 |
1994 |
1995 |
1996c |
1997c |
1998c |
1999c |
2000 |
2001 |
2002 |
to |
|
2002 |
||||||||||||||
|
GDP(a) |
4098.0 |
3077.0 |
323.7 |
492.2 |
643.3 |
1286.5 |
1620 |
1670 |
1790 |
1850 |
1960 |
2100 |
2365 |
-4.48 |
|
GDP(b) per capita |
1144.7 |
N/A |
87.8 |
131.9 |
171.7 |
342.2 |
424 |
433 |
472 |
487 |
515 |
558 |
786 |
-3.1 |
|
GDP by sector (%) : |
||||||||||||||
|
-Agriculture |
17 |
25 |
31 |
51 |
45 |
43 |
37 |
32 |
34 |
29 |
25 |
28 |
26 |
|
|
-Industry |
52 |
49 |
39 |
27 |
37 |
36 |
33 |
33 |
31 |
33 |
36 |
34 |
33 |
|
|
-Services |
31 |
26 |
30 |
22 |
18 |
21 |
31 |
35 |
35 |
39 |
39 |
38 |
41 |
(a) Millions of current US$ at market prices
(c) Data
& Statistics/The World Bank
(b) Current US$ per capita at market prices
Source: IAEA Energy and Economic
Data Base; Data
& Statistics/The World Bank; Country Information.
Armenia is not rich in mineral raw materials. There are only a few items of considerable industrial value: copper, bauxite, molybdenum, precious metals, perlite, diatomite and coal. This factor mainly determines the economic structure of the republic. There has traditionally been very little heavy industry. The manufacturing sector has a prevailing share in GDP.
1.1.2 Energy Situation
The main sources of energy, traditionally used in Armenia, are: oil products,
natural gas, nuclear energy, hydropower and coal. Hydro and a small amount of
brown coal are the only domestic sources of energy, which are exploited. The
republic has no oil and some gas reserves (not exploited). There are no uranium
resources either. The energy reserves are shown in Table 5. Primary energy sources,
in thousand tonnes of oil equivalent, are summarized in Table 6. To meet its
energy requirements, Armenia has to import gas, oil products and nuclear fuel.
TABLE 5. ESTIMATED ENERGY RESERVES
|
|
Solid |
Liquid |
Gas |
Uranium (a) |
Hydro (b) |
Total |
|
Total amount in place |
N/A |
N/A |
6.48 |
N/A |
2.12 |
8.60 |
(a) This total represents
essentially recoverable reserves.
(b) For comparison
purposes a rough attempt is made to convert hydro capacity to energy by multiplying
the gross theoretical annual capability (World Energy Council - 1998) by a factor
of 10.
Source: IAEA Energy and Economic Data Base.
TABLE 6. PRIMARY ENERGY SOURCES
ktoe
|
Year |
Coal and Wood |
Petroleum Products |
Gas (Natural + LPG) |
Nuclear |
Hydro |
Electricity (Imp-Exp.) |
Total |
|
1996 |
22 |
411 |
900 |
606 |
135 |
N/A |
2.074 |
|
1997 |
16 |
437 |
1.137 |
418 |
119 |
-5 |
2.122 |
|
1998 |
17 |
477 |
1.220 |
415 |
132 |
-32 |
2.229 |
|
1999 |
8 |
380 |
1053 |
542 |
103 |
-21 |
2.065 |
|
2000 |
2 |
322 |
1247 |
521 |
108 |
-40 |
2160 |
|
2001a) |
- |
- |
- |
- |
- |
- |
- |
|
2002a) |
- |
- |
- |
- |
- |
- |
- |
Source: Country Information.
a) information is not available
Hydropower is based on the water resources of the republic, including Lake Sevan, one of the largest highland fresh-water lakes in the world (1 900 m above sea level), and the rivers: Arax, Arpa, Hrazdan, Debet and Vorotan. During the last period of time, several small hydro power plants with the total capacity of 15 MW have been built. Hydro power plants of the Sevan-Hrazdan cascade are operating at a low level capacity, because, after the intense use of the lake water during the last crisis, the Government of Armenia decided to reduce releases from Lake Sevan to restore its potential. At the same time, Armenia has still an unused hydraulic potential of about 300 MW (or 1248 millions kWh of electric energy) that can be developed economically. The detailed information on all the power plants in Armenia is given in Appendix 2.
Natural gas is the most important source of energy covering up to 80% of the
total energy supply. It is imported from Russia and used to operate two thermal
power plants; a third thermal power plant is not operating, because it was built
to supply thermal energy to an industrial factory, which is no longer in operation.
However, the plans have been under discussion to restart this thermal power
plant together with that industrial factory. The designed capacity of the high-pressure
gas transportation network of Armenia is 17 billions m3/year. In 1980, the maximum
demand for natural gas in Armenia was above 5-6 billions m3/year. There have
been five main gas pipelines built, which ensured the gas delivery from three
sides: Georgia, North and West Azerbaijan. Today, only the first one is operating.
In 2002, the natural gas demand was 1.1 billions m3, but the expected demand
by the year 2015 will be 5.5 - 6.2 billions m3/year depending on the ANPP status
(closed or in operation). There are underground storage facilities for natural
gas with a maximal gas storage volume of 180 million m3. Gas distribution in
Armenia is performed through high, medium and low-pressure distribution networks.
Oil products are imported from the neighbouring countries, mostly utilized for
transport, industry, residential sector (heating) and as secondary fuel (mazut)
in thermal power plants. During the last several years, mazut was not imported
into the republic. As to the renewable sources of energy (geothermal, wind,
solar and waste burning), they are under study and not yet available.
Armenia has a considerable potential of geothermal energy, but a programme
has to be developed to explore the geothermal resources and to carry out drilling
activities. Wind power projects (the construction of power stations) are still
under discussion. The most worth-while regions suitable for the construction
are: Vanadzor, Aragats, Lake Sevan basin and Sisian, where the wind velocity
reaches 7 m/s. Armenia is a sunny republic with a high level of solar radiation.
Nevertheless, it is too expensive to utilize the solar energy, and the republic,
which appears to have very good solar radiation potential, cannot afford using
it. A waste burning facility project (the construction of a station with a capacity
of 10 MW in Yerevan) is under discussion as well.
Nuclear energy played a crucial role during the period of recovery from the
economical crisis. There is one nuclear power plant in Armenia - Armenian Nuclear
Power Plant (ANPP), which has two reactor units. Unit 1 is out of operation,
and Unit 2 was re-commissioned in 1995, after 6.5 years of outage. The nuclear
fuel necessary for the ANPP operation is supplied by the Russian Federation.
In Armenia, the primary energy per capita is around 0.65 toe/capita (2000). Energy statistics are shown in Table 7. The country total energy consumption shows a steady increase at a rate, which is significantly greater than the increase of GDP.
TABLE 7. ENERGY STATISTICS
Exajoule
|
1995 |
1996 |
1997 |
1998 |
1999 |
2000 |
2001(4) |
2002(4) |
|
|
Energy consumption |
||||||||
|
- Total (1) |
0.08 |
0.09 |
0.09 |
0.09 |
0.09 |
0.09 |
- |
- |
|
- Solids (2) |
N/A |
0.001 |
0.001 |
0.001 |
0.00 |
0.00 |
- |
- |
|
- Liquids |
0.02 |
0.02 |
0.02 |
0.02 |
0.013 |
0.016 |
- |
- |
|
- Gases |
0.04 |
0.04 |
0.05 |
0.05 |
0.052 |
0.044 |
- |
- |
|
- Primary electricity
(3) |
0.02 |
0.03 |
0.02 |
0.02 |
0.026 |
0.027 |
- |
- |
|
Energy production |
- |
- |
||||||
|
- Total |
0.02 |
0.03 |
0.02 |
0.02 |
0.026 |
0.027 |
- |
- |
|
- Solids |
N/A |
0.001 |
0.001 |
0.001 |
0.00 |
0.00 |
- |
- |
|
- Liquids |
- |
- |
- |
- |
- |
- |
- |
- |
|
- Gases |
N/A |
N/A |
N/A |
N/A |
0.00 |
0.00 |
- |
- |
|
- Primary electricity
(3) |
N/A |
0.03 |
0.02 |
0.02 |
0.026 |
0.027 |
- |
- |
|
Net import (import - export) |
- |
- |
||||||
|
- Total |
0.06 |
0.06 |
0.07 |
0.07 |
0.064 |
0.06 |
- |
- |
|
- Solids |
0.00 |
0.00 |
0.00 |
0.00 |
0.00 |
0.00 |
- |
- |
|
- Liquids |
0.02 |
0.02 |
0.02 |
0.02 |
0.013 |
0.016 |
- |
- |
|
- Gases |
0.04 |
0.04 |
0.05 |
0.05 |
0.051 |
0.043 |
- |
- |
(1) Energy consumption = Primary energy consumption
+ Net import (Import - Export) of secondary energy.
(2) Solid fuels include coal, lignite and
commercial wood.
(3) Primary electricity = Hydro + Geothermal
+ Nuclear + Wind.
(4) Information is not available
Source: IAEA Energy
and Economic Database and Country Information.
Table 8 shows the energy consumption
data during the years.
TABLE 8. TOTAL FINAL ENERGY CONSUMPTION
|
1996 |
1997 |
1998 |
1999 |
2000 |
2001(1) |
2002(1) |
||
|
Total final consumption |
ktoe |
984 |
1 087 |
1 186 |
1 009 |
1122 |
- |
- |
|
Consumption increase |
% |
|
10.6 |
9.0 |
-14.9 |
11.2 |
- |
- |
|
GDP increase |
% |
5.8 |
3.1 |
7.2% |
3.3 |
6.0 |
9.6 |
12.9 |
Source: Country Information.
(1) Information is not available
The data on energy consumption by sector (Table 9) do not show the major changes during the years. The energy consumption of Yerevan city is about 50% of the total energy consumption in Armenia.
TABLE 9. ENERGY CONSUMPTION BY ECONOMY SECTOR
ktoe
|
Economy Sector |
1996 |
1997 |
1998 |
1999 |
2000 |
2001(1) |
2002(1) |
|
Industry |
240 |
295 |
291 |
203 |
276 |
- |
- |
|
Transport |
310 |
350 |
379 |
319 |
280 |
- |
- |
|
Agriculture |
59 |
62 |
65 |
77 |
74 |
- |
- |
|
Commerce and public service |
84 |
84 |
118 |
132 |
216 |
- |
- |
|
Residential |
261 |
250 |
295 |
229 |
223 |
- |
- |
|
Nonspecified |
- |
- |
10 |
- |
- |
- |
- |
|
Non-energy use |
30 |
45 |
29 |
49 |
54 |
- |
- |
|
Total energy consumption |
984 |
1 087 |
1 186 |
1009 |
1123 |
- |
- |
Source: Country Information.
(1) Information is not available
1.2. Energy Policy.
Before the disintegration of the USSR, Armenia, as a part of the Soviet Union, was under the All-Union energy policy. The electricity generated by Armenian power plants was supplied into the Unified Transcaucasien Energy System. After becoming an independent state, Armenia had to meet the open market requirements in all the sectors of the industry including the energy sector. It was in need of reorganization and de-regulation too.
In March 2001, the National Assembly adopted a new edition of Law "On Energy
of the Republic of Armenia". According to this Law, the main principle
of the Government policy in the Energy sector is the separation of functions
of economic activity, State management and regulation. According to that regulating
principle, the inequality of conditions between the licensee and consumer was
excluded.
According to the Law "On Energy of the Republic of Armenia", the functions
of regulation are performed by the Energy Regulatory Commission which was established
in 1997. Its general duty is to establish the proper electricity tariffs in
the Energy sector. The Commission was renamed, and now it is called the Commission
on Regulation of Natural Monopolies.
The level of electricity average tariff was increased from 12 drams in 1995
to 21.6 drams, and the residential tariff to 25 drams (US $1= 540 Dram) that
is in use by nowadays. The energy sector cost analysis has shown that in short-term
perspective it is possible to stabilize the level of costs and restrain the
increase of tariffs through promotion of the efficiency of power generation
and improvement of transmission and distribution of electric energy, as well
as by extension of the electricity market, loss reduction and other measures.
In March 2000, the National Assembly adopted the Law "On Amendments and
Additions to the Law On safe Use of Nuclear Energy for Peaceful Purposes".
In particular, one of the amendments reads: "Those objects which are of
safety importance shall be constructed and decommissioned by the relevant law".
Armenia ratified the Convention on Climate change on 8 of May 1993, and the
Kyoto Protocol on 26 of December 2002.
A programme for improvement of metering, billing and collection of payments
for electricity, heat and natural gas is being implemented, together with the
transfer of accounting to international norms and standards and annual auditing
of the company's financial reports by independent auditors. A programme has
been implemented to organize collections through banks. Though there are difficulties
in the whole economy of the country, the Government gives priority to budget
payments for the electricity provided to budget organizations as well as compensation
for the electricity consumed by irrigation, drinking water, industry and electrical
transport companies.
In the district heating sector, a number of problems concerning physical wear
of heating network equipment, lack of industrial heat consumption and low level
of payment collection in the residential sector exists. The Government of the
Republic of Armenia, together with the WB, developed the Strategy on district
heating rehabilitation that was endorsed by the Government decree "On Reforming
the District Heating System in Armenia" N 1384, 05.09.2002.
The results of asset revaluation show that the sector's main assets resources
have already expired. The equipment is worn out and requires major overhaul,
38% of installed capacities are already over 30 years old. It is necessary to
take all due measures to renew the energy sector of Armenia. In order to attract
the investments into the Energy Sector of the Republic of Armenia, the following
laws were adopted:
-
the Law on Foreign Investment;
-
the Law on Enterprises and
Entrepreneurial Activities;
-
the Law on Privatization and
De-monopolization;
-
the Law on Real Estate;
-
the Law on Taxes (enables more
favourable treatment for foreign investors);
1.3. The Electricity System
1.3.1. Structure of the Electricity Sector
The structure of the Energy Sector in Armenia is shown in Figure 3.
The Ministry of Energy is responsible for the sustainable electric energy supply
to the consumers. Its responsibility is also to define the policy for the whole
Energy sector development.
The ANRA duties are: to perform State nuclear energy regulation and supervision
over the nuclear power objects and to license those objects. Its main objective
is to secure the protection of the population, the personnel involved into the
nuclear industry, and environment.
The Commission on Regulation of Natural Monopolies is responsible for the antimonopoly regulation. The key functions of the antimonopoly regulation are tariff regulation and licensing the entities in the energy sector.
"Armenergo" is a wholesale buyer-reseller of generated electricity and is responsible for dispatching and efficient electricity delivery.
FIG. 3. Structure of the Energy Sector
1.3.2. Electricity Sector Decision Making Process
In 1998, a new energy policy was developed by the Government of Armenia, with
the evaluation of the National Energy Balance as a main factor and a starting
point for the National Energy Strategic Plan elaboration. The plan was further
developed when, in the frame of the IAEA TC project - ARM 0/004, the document
" Energy and Nuclear Power Planning Study for Armenia, covering the period
up to 2020 " was accomplished (2002). The document includes the future
energy demand forecast for Armenia and the capacities which will be needed to
cover that demand.
A special attention was addressed by the Government to restructuring the energy
sector. A number of laws in energy were adopted to achieve that target. Several
small HPPs have been privatized. The implementation of a stabilization policy
with the crucial role of restarted ANPP allowed the country to overcome the
energy crisis of the post-Soviet period. Now Armenia is covering its electricity
demand completely and can ensure the export of electric power to neighbouring
countries. In the nearest future, however, additional energy sources may be
required as the economy of the republic is recovering, and the living standard
is increasing steadily.
Also, the item of great importance which must be taken into consideration during the decision making process is the insurance of the provision that the electrical system expansion, economic management and regulation should not be harmful for the environment.
1.3.3. Main Electricity Indicators
In 2002, the total installed capacity of the generating stations in Armenia was 3 050 MW. The annual electricity production was 5.48 billion kWh. Table 2 shows the statistics of the electricity production balance, and Table 10 - the energy related ratios. In addition, Figures 5 to 8 show the total electricity production, the electrical energy balance, the annual electric energy consumption per capita, and the share of electricity in the total energy consumption.
TABLE 10. ENERGY RELATED RATIOS
|
|
1995 |
1996 |
1997 |
1998 |
1999 |
2000 |
2001 |
2002 |
|
Energy consumption per
capita (GJ/capita) |
22.17 |
27.6 |
23.6 |
24.9 |
22.9 |
24.2 |
- |
- |
|
Electricity per capita
(MW·h/capita) |
1.46 |
1.62 |
1.62 |
1.64 |
1.53 |
1.58 |
1.51 |
1.71 |
|
Electricity production/Energy
production (%) |
- |
82 |
111 |
108 |
75 |
81 |
- |
- |
|
Nuclear/total electricity
(%) |
0.0 |
36.4 |
26.5 |
25.7 |
36.4 |
33.7 |
34.5 |
42 |
|
Ratio of external dependency
(%) (1) |
76.9 |
63.9 |
74.5 |
75.6 |
67 |
68 |
- |
- |
|
Load factor of electricity
plants |
|
|
|
|
|
|
|
|
|
- Total (%) |
23 |
23.6 |
22.6 |
22.6 |
20.8 |
22.3 |
21.4 |
20,4 |
|
- Thermal |
21.8 |
16.0 |
20.8 |
20.0 |
15.9 |
18.4 |
19.1 |
11 |
|
- Hydro |
21.6 |
17.7 |
15.9 |
17.4 |
13.6 |
14.3 |
11.0 |
18 |
|
- Nuclear |
N/A |
63.6 |
48.5 |
48.2 |
63 |
61 |
60 |
69 |
(1) Net import / Total
energy consumption.
Source: IAEA Energy and Economic Database; Country
Information.
FIG. 5. Total Electricity Production
FIG. 6. Electrical Energy Balance
FIG. 7. Electrical Energy Consumption
FIG. 8. Share of Electricity in Total Energy Consumption
2. NUCLEAR POWER INDUSTRY
2.1. Historical Development and current nuclear power organizational structure
2.1.1. Overview
A decision to construct a nuclear power plant in Armenia was made by the former USSR Council of Ministers, and the appropriate decree was issued in September 1966. In 1968, the Armenian Branch of ''Electrosetproject'' institute completed the pre-feasibility study for constructing the Armenian NPP (ANPP) under the project "The Scheme of NPP Contribution to Power Grid". That document included a schedule to commission Unit 1 in 1973, and Unit 2 - in 1974.
The technical specification to design the ANPP was developed by "Teploelectroproject"
in 1968 and approved in August 1969 under decree No. 1624 R.C. of the USSR Ministry
of Energy.
More than 20 potential sites were considered for the ANPP construction, and
finally a site was selected in the western part of Ararat valley, 16km far from
Turkish border, 10km to the north-east of region centre - Hoktemberyan (Armavir),
and 28 km far (to the west) from Yerevan. Location of ANPP is shown in Figure
1.
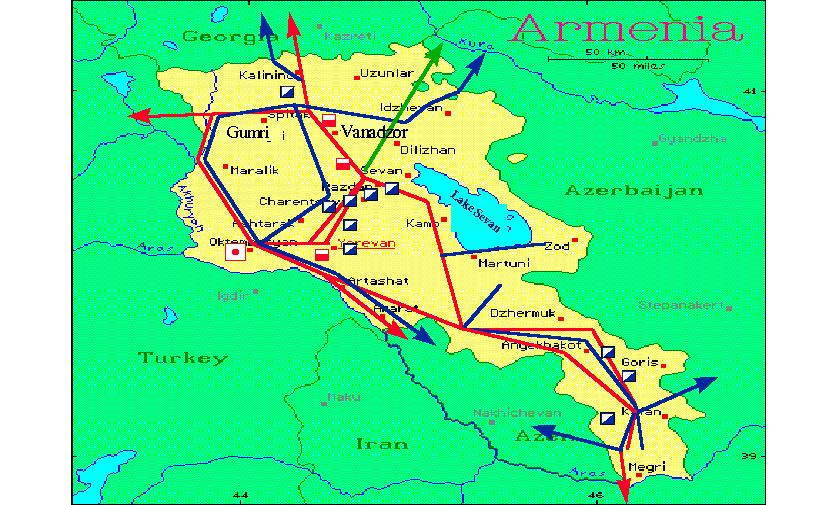
FIG. 1. Map of locations of all electricity generating power plants and main high voltage interconnections with the neighbouring countries.
In accordance with that specification, the capacity of the ANPP (first stage
of construction) with WWER-440 type reactors was to be 815,0 MW, each unit -
407.5 MW. The ANPP design life-time was specified to be 30 years.
The comprehensive studies and analyses showed that seismic conditions of the ANPP site were characterized by the level that corresponded to the eight-point intensity according to MSK-64 scale. That was the first nuclear power plant in the USSR intended to be constructed in the region of high seismicity.
The specific nature of the ANPP site - its seismicity - caused significant changes
in WWER-440/230 design, not only in construction but also in design of reactor
facility in the whole, and the reactor was assigned with the new identification
- V-270. It was based on the project of Unit 3 of the Novovoronezh NPP.
The reactor building, auxiliary building, air chimney, as well as the buildings
and structures containing equipment and instrumentation of safety systems or
safety-related on-line systems and communications connecting these structures
were assigned with category of High Importance. They were considered to have
one point more seismic resistance than that of the ANPP site.
The Armenian Nuclear Power Plant was commissioned in 1976, with achieving the
initial criticality for Unit 1 on 22 December 1976, and for Unit 2 - on 5 January
1980. The units were put into commercial operation on 6 October 1977 and on
3 May 1980, respectively.
In 1981, the technical-economic background was developed for the further expansion
of the ANPP (the second stage of the plant) taking into consideration the needs
of Yerevan city in a central heating. The technical-economic background was
approved and co-ordinated with all the relevant organizations. In 1985, the
Gorky Department of "Atomteploelectroproect" Institute prepared a
project: "Armenian NPP. Its expansion, taking into consideration Yerevan
city central heating". The excavation work was started. The foundation
pits for two new units (Unit 3, Unit 4) were dug through. But it was the Chernobil
disaster of 1986 that served a reason for the Government of the Republic to
make a decision to refuse further expansion of the ANPP. The work was stopped.
After the 1988 earthquake, though the Power Plant was not damaged, the Council
of Ministers of the USSR decreed to shut down the ANPP as a precautionary measure.
Unit 1 was shut down on 25 February 1989 and Unit 2 on 18 March 1989. The units
were not decommissioned but kept in prolonged shut down condition.
In April 1993, the Government of Armenia decided to restart Unit 2 of the ANPP in order to overcome the severe economic crisis, taking into account the lack in national energy resources. After 6.5 years of outage, with the technical and financial help of the Russian Federation, Unit 2 of the ANPP was restarted in November 5, 1995. Unit 1 remained in a stand-still regime.
After the ANPP restart, 14billion 170mln kWh electric power has been generated
by January 1, 2003, keeping the loads schedule of Armenian power system.
Apart from the short period of regaining independence (1988-1989), there have been no strong antinuclear movements in Armenia. The current sentiment of the public can be explained not by lack of awareness of the risks involved by the utilization of nuclear energy, but, in the face of the difficult economic conditions, by the considerably lower price of "nuclear electricity" which outweighs its possible risks
2.1.2. Current Organizational Chart
When in 1993 the decision was made to restart the ANPP, several new organisations
were established.
On 27 of August 1993, the Department of the ANPP Operation (Armatomenergo) under the Ministry of Energy was established by the Governmental decree N 435. Armatomenergo was authorised with the functions of Operator of the ANPP.
On 16 of November 1993, the Armenian Nuclear Regulatory Authority (ANRA) at
the Government of RA was established by the Governmental decree N573. The ANRA
was authorized to be a regulation body in the area of nuclear and radiation
safety, to perform inspection activity and issue the licenses for the appropriate
applications.
On 4 of April 1996, the Government of Armenia decided (decree N 98) to liquidate
the "Armatomenergo" Department and transfer the functions of Operator
to the CJSC "Armenian NPP". At the same time, the Department of Atomic
Energy was established at the Ministry of Energy.
The ANPP is operating in close cooperation with such organizations as CJSC "Armatom",
CJSC "Atomservice" and CJSC "Atomenergoseismoproject".
The "Armatom" institute was created in 1973. It has been rendering
the engineering support to the ANPP since its date of creation. The institute
activity included: implementation of diagnostic systems; implementation of Safety
Parameters Display System (SPDS), creation of a compact simulator, and then
of a multi-functional one. Now "Armatom" is participating in development
of "Deterministic Analysis of ANPP Unit 2" and "Probabilistic
Safety Analysis of ANPP Unit 2".
CJSC "Atomservice" was created in 1987. The company took active part
in the ANPP systems adjusting and testing programs implementation during the
period of preparation for the ANPP Unit 2 restart. It continues to perform the
same activity nowadays.
CJSC "Atomenergoseismoproject" was created in 1983. During the period
of preparation of Unit 2 of the ANPP for its restart in 1993-1995, a set of
works on finishing investigations of the plant seismic conditions was performed
by CJSC "Atomenergoseismoproject" for final resolution and approvement
of the possibility of the plant restart and further operation. The whole processes
of work and final resolution were considered and discussed with the IAEA experts.
One of the major results of conducted investigations was the proving that the
ANPP has been erected on a whole (undestructed) basalt block, i.e. absence of
tectonically active break under the ANPP site was proved.
2.2. Nuclear Power Plants: Status and Operations
2.2.1. Status of nuclear power plants in operaiton, under construciton, closed down.
The ANPP consists of two nuclear power units of WWER-440 type. Since 1989,
Unit 1 is in a state of stand-still. Since its restart (1995), Unit 2 of the
ANPP has been in operation. Unit 2 installed gross capacity is 407.5 MW.
The total production of electricity in Armenia during 2002 amounted to 5,475
billion kW·h, with the nuclear share - 2,286 billion kW·h. The
comparative figures on the electricity production in Armenia for all the power
plants are shown in Table 2.
Table 1 shows the status and some other indicators of the nuclear power units
of the ANPP.
TABLE 1. STATUS OF NUCLEAR POWER PLANTS
|
Units |
Type |
Net |
Operator |
Status |
Reactor |
|
|
|
Capacity |
|
|
Supplier |
|
ARMENIA-2 |
WWER |
376 |
CJSC ANPP |
Operational |
MTM |
|
ARMENIA-1 |
WWER |
376 |
CJSCANPP |
Shut Down |
MTM |
|
Units |
Turbogenerator |
Construction |
Criticality |
Grid connection |
Commercial |
Shutdown |
|
|
Supplier |
Date |
Date |
Date |
Date |
Date |
|
ARMENIA-2 |
KHTP |
01-Jul-75 |
05-Jan-1980 |
05-Jan-1980 |
31-May-1980 |
|
|
ARMENIA-1 |
KHTP |
01-Jan-73 |
22-Dec-1976 |
28-Dec-1976 |
06-Oct-1979 |
25-Feb-1989 |
Note: Armenia 2 was shutdown
in 1989 and restarted operation in November 1995
Source: IAEA Power Reactor Information System as of
31 December 2002
There is no nuclear power unit under construction in Armenia nowadays.
2.2.2. Performance of NPPs.
The main organizations and institutions involved in nuclear energy in Armenia
are: the Ministry of Energy, the Armenian Nuclear Regulatory Authority, CJSC
"ANPP", CJSC "Armatom", CJSC "Atomservice" and
CJSC "Atomenergoseismoproject". Besides, some technical support has
been providing by such organizations of Russian Federation as: OKB "Hydropress"
- main reactor designer; "NIIAEP Nizhnii Novgorod" - main NPP designer;
RNC "Kurchatov Institute" - scientific management, and others.
The issues of the ANPP safety upgrading are of much importance for the Armenian
Ministry of Energy being first-rate priority. The safety level of the ANPP during
the times of very limited financial resources was one of the main concerns of
the Armenian Government. After numerous consultations with the experts from
the USA, countries of Western Europe and Russian Federation, Armenian specialists,
with the assistance rendered by the IAEA experts, developed a new programme
of the ANPP safety-upgrading. It was called "List of measures for Unit
2 of the Armenian NPP safety and reliability upgrading for the period of 2001
- 2004", and was introduced to replace the previous one. The safety-upgrading
process, having been permanently implemented at the ANPP, has been realizing
according to the provisions of that programme.
US DOE and EC TASIC greatly assisted to the ANPP with implementation of many
measures from that List. The activities enabled the ANPP to have the safety
level increased much, so that the plant can withstand emergency situations without
failures.
The information on the ANPP operational quality is given below.
In 1995, Unit 2 of the ANPP had five emergency events of level "0"
on the International Nuclear Event Scale (INES). In 1996, there were 8 emergency
events occurred at the ANPP, including: 1 - of level "1", 7 of level
"0" on the INES scale. In 1997, there were 5 emergency events occurred
at the ANPP, including: 2- of level "1", 3 of level "0"
on the INES scale. In 1998, there were 7 emergency events occurred at the ANPP,
including: 2- of level "2", 1- of level "1" and 4 of level
"0" on the INES scale. In 1999, had one emergency shutdown and one
event of level "1". In 2000, there were 3 events reported, one event
was rated level "1", and two events were rated level "0".
In 2001, there were 8 emergency events occurred at the ANPP, including: 3 -
of level "1", 5 of level "0" on the INES scale. In 2002,
there were 8 emergency events of level "0" on the INES scale occurred
at the ANPP, including 2 emergency shutdowns.
2.2.3. Nuclear electricity generation, share in operation electricity generation
The information on a total electricity generation and its distribution by plants
types, as well as the capacities of those plants, is given in Table 2.
TABLE 2. ELECTRICITY PRODUCTION AND INSTALLED CAPACITY
|
|
|
|
|
|
|
|
|
|
|
|
|
|
|
|||||||||||||
|
|
|
1988 |
1992 |
1993 |
1994 |
1995 |
1996 |
1997 |
1998 |
1999 |
2000 |
2001 |
2002 |
|||||||||||||
|
|
|
|
|
|
|
|
|
|
|
|
|
|
|
|||||||||||||
|
Electricity production (TW·h) |
|
|
|
|
|
|
|
|
|
|
|
|
|
|||||||||||||
|
- Total (1) |
15.28 |
9.00 |
6.29 |
5.66 |
5.57 |
6.22 |
6.03 |
6.19 |
5.72 |
5.96 |
5.74 |
5.48 |
|
|||||||||||||
|
- Thermal |
8.94 |
5.96 |
2.00 |
2.14 |
3.34 |
2.33 |
3.03 |
3.06 |
2.44 |
2.69 |
2.79 |
1.58 |
|
|||||||||||||
|
- Hydro |
1.52 |
3.04 |
4.29 |
3.51 |
1.93 |
1.57 |
1.40 |
1.54 |
1.20 |
1.26 |
0.97 |
1.61 |
|
|||||||||||||
|
- Nuclear |
4.82 |
- |
- |
- |
0.30 |
2.32 |
1.60 |
1.59 |
2.08 |
2.01 |
1.98 |
2.29 |
|
|||||||||||||
|
Capacity of electrical
plants (GW(e)) |
|
|
|
|
|
|
|
|
|
|
|
|
|
|||||||||||||
|
- Total |
3.51 |
2.75 |
2.75 |
2.75 |
2.75 |
3.04 |
3.04 |
3.13 |
3.13 |
3.05 |
3.05 |
3.05 |
|
|||||||||||||
|
- Thermal |
1.75 |
1.75 |
1.75 |
1.75 |
1.75 |
1.66 |
1.66 |
1.75 |
1.75 |
1.67 |
1.67 |
1.67 |
|
|||||||||||||
|
- Hydro |
1.00 |
1.00 |
1.01 |
1.00 |
1.00 |
1.00 |
1.00 |
1.00 |
1.00 |
1.00 |
1.00 |
1.00 |
|
|||||||||||||
|
- Nuclear |
0.76 |
0.0 |
0.0 |
0.0 |
0.0 |
0.38 |
0.38 |
0.38 |
0.38 |
0.38 |
0.38 |
0.38 |
|
|||||||||||||
(1) Electricity losses are not deducted.
Source: IAEA
Energy and Economic Database; Country Information.
2.2.4. Nuclear power development projections and plans.
In the frame of the IAEA TC project - ARM 0/004, there was developed the document " Energy and Nuclear Power Planning Study for Armenia, covering the period up to 2020 " which was completed in 2002. The document includes the future energy demand forecast for Armenia and the capacities which will be needed to cover that demand. During the study, the two options were chosen for Armenian energy system development - with the use of nuclear power and without it. According to that study, the first option is more preferable for Armenia because it can ensure the energy independence and energy security of the country, taking into consideration the fact that Republic of Armenia has limited domestic energy sources. According to the study, it will be needed to put into operation two new medium-size nuclear units, one in 2015, the other - in 2017.
2.3. Supply of NPPs.
Both units of the ANPP with the WWER- 440 (V-270) type reactors were designed
and constructed by organizations of the former Soviet Union under the supervision
of the Ministry of Energy and Electrification of the USSR. The design of the
first stage of the plant was developed in 1969-1970. The chief scientific supervisor
was Kurchatov Institute of Atomic Energy (Moscow). Now it is called RNC "Kurchatov
Institute". The chief design organization was Thermoelectroproect (TEP),
Gorki. Now it is called NIAEP, Nizhny Novgorod. The main reactor construction
organization was OKB "Gidropress", Podolsk. The "Izhora Factory"
Leningrad Enterprise was the manufacturer of the reactors and systems. The turbines
were manufactured by the Kharkov Turbine Plant (KHTP). The electric generators
were supplied by the "Electrosila" plant of Leningrad.
The building-construction work was performed by the "Gidroenergostroy",
Yerevan.
All the nuclear fuel necessary for the ANPP operation was delivered in the past and has been delivering now by the "TVEL" concern of Russian Federation.
2.4. Operation of NPPs
In Armenia, the objects of Nuclear Energy are of State monopoly. In order
to improve the ANPP management, the Government of RA issued a decree on "The
Measures for Management Upgrading within the Energy Sector of RA", N 166,
22.02.2002. According to that decree, the management of the ANPP was transferred
to five officials, in equal shares, so they are authorized to supervise over
the ANPP shares. Those official are: the Prime Minister of RA, the Minister
of Energy of RA, the Minister of Finance and Economy, the Minister of Justice
and the Minister of Management of State Property.
Although the CJSC "Armenian NPP" was authorized to be the Operator
of the ANPP, for other purposes, such as liability to foreign countries, the
State is assumed to be the Operator.
2.4. Fuel Cycle, Spent Fuel and Waste Management Service Supply
Armenia has no fuel cycle industry. Up to now, all the nuclear fuel has been
supplied by Russia. Originally, the spent nuclear fuel generated by the ANPP
was managed by the Soviet Union central agencies of reprocessing and final disposal
of the spent nuclear fuel. The recovered uranium and plutonium were retained
by the central agencies in the Soviet Union. However, with the disintegration
of the Soviet Union, Armenia had to find other solutions.
The ANPP is operating with the three-year fuel cycle. The spent nuclear fuel,
before its transfer to the dry storage, is being kept in the wet nuclear fuel
storages - fuel ponds.
In 2000, the construction of the first stage of spent fuel dry storage was
completed. The construction was commissioned by the French firm Framatom and
financed by the French Government. The spent fuel dry storage facility has been
put into operation, and all the transportations of spent fuel were performed
according to the requirements of the license given by the ANRA. Now, all the
volume of the storage is filled with the spent fuel. It is envisaged to construct
the second stage of the dry storage facility.
The final spent fuel and radwaste treatment and disposal concept will be developed and included into the ANPP Decommissioning Programme.
2.6. Research and Development Activities
There are no major R&D activities in the country.
2.7 International Co-operative Projects and Initiatives
Armenia has bilateral cooperation, mostly concerning safety of the ANPP, with such countries as Argentina, France, Italy, Russian Federation, UK and USA. Armenia also participates in several international projects in the frame of cooperation under the aegis of IAEA, TACIS (EC) and USAID.
Very close cooperation is established with the IAEA. Armenia has become a member of this organization since 1993. The IAEA experts have been participating in many various assistance projects since then. When in April 1993 the Government of Armenia made the decision to restart Unit 2 of the ANPP, the IAEA experts participated actively in pre-commissioning investigations and were performing the evaluation of the plant equipment condition. Moreover, they elaborated the whole concept of Unit 2 re-commissioning. Armenia is also collaborating with the IAEA in the field of nuclear safety upgrading. At present, several national programmes of the ANPP Unit 2 safety upgrading are in different phases of implementation. The IAEA is permanently assisting the ANRA providing it with the appropriate support and recommendations.
Since 1996, the EC started, within the framework of TACIS Assistance Programmes, the implementation of projects aiming at technical assistance in upgrading a level of the ANPP operation, as well as modernization of the plant technological equipment, construction of a multifunctional simulator for the ANPP, etc. Since 2000, a new cycle of the ANPP safety upgrading projects was initiated within the framework of TACIS Assistance Programmes.
Armenia cooperates with Argentina in the frame of bilateral project "Creation
in Armenia of a Center for training and qualification in Non-Destructive Metal
Testing Techniques".
French experts from FRAMATOM were involved in a joint project of construction
of the first stage of the spent fuel dry storage facility. The work started
in 1996, and the storage has been now in operation.
The Italian firm SOGIN together with the CSJCs Armatom and Atomservice is working on the development of a part of the Probability Safety Analysis for the ANPP.
The Russian Federation is also an active partner of Armenia. There are many joint projects within the framework of the Nuclear Safety Assistance Programme, which are realized in close co-operation with the Russian experts. They also took active part in pre-commissioning and restart of Unit2 of the ANPP. In 1996, an agreement was signed between the ANPP and ROSENERGOATOM on industrial and technical-scientific co-operation. In 2000, the agreement was signed between the Governments of RA and RF on "Cooperation in the field of peaceful use of nuclear energy".
There are a number of projects financed by the US Department of Energy (US DOE). Since 1996, in the frame of the Nuclear Safety Assistance Programme for Armenia, the USA specialists have implemented at the ANPP many technical assistance projects aiming at upgrading the safe operation of a plant. Among their number, the projects on improving the fire protection systems and purchasing the equipment for the new cooling system. They assisted also in computerization of the safety system and procurement of the equipment for the ANPP safe operation. The experts from US DOE are also participating in the development of a programme for future decommissioning of the ANPP.
In the frame of bilateral cooperation between the two countries, in 2001, at
the "Armatom" institute of RA, the International Nuclear Safety Center
of Armenia was created. The Joint Statement on cooperation between International
Nuclear Safety Centers of Armenia and USA was signed on 07.02.2001.
In 2000, the implementation of joint projects carried out with the assistance of the Department of Trade and Industry (DTI) of the United Kingdom was started. The projects were fulfilled in the frame of an assistance programme aiming at the ANPP safety upgrading. The activity included, in particular, the elaboration of plant operational procedures and development of a Quality Assurance programme.
The cooperation related to the establishment of an emergency centre for the
ANPP is still under way, and the development of some parts of the Probability
Safety Analysis for the ANPP has been continuing.
Since 1996, the ANPP is a member of World Association of Nuclear Operators
(WANO). The Moscow Centre of WANO has conducted at the ANPP two inspection checks
with the intention to verify the plant's operational safety.
The ANRA has agreements for cooperation with Nuclear Regulatory Authorities of the following countries: Russia, USA, Argentina and Ukraine. The ANRA is a member of the FORUM organization, which members are the nuclear regulatory authorities from the countries operating WWERs. The ANRA participates also in the CONCERT Group work.
3. NATIONAL LAWS AND REGULATIONS
3.1. Safety Authority and Licensing Process
The state authority for supervision on nuclear and radiation safety was established
by Government decree N573, 16.11.1993. It was called the State Department for
Supervision on Nuclear and Radiation Safety of Utilization of Nuclear Energy
at the Government of RA. By the same decree, the Statute of the ANRA was approved,
and the authority was empowered to act as inspection.
By Government decree N70, 19.02.2000, the Department was authorized to have
also the regulating functions, and, in accordance with that decree, a new Statute
of the authority was prepared. It was approved by Government decree N385, 22.06.2000.
A new name was given to he Department - the Armenian Nuclear Regulatory Authority
(ANRA). The ANRA was under a direct subordination to the Armenian Government
and independent from those organizations responsible for development and utilization
of nuclear energy. According to its new Statute, the ANRA was to organize and
perform State supervision and inspection on utilization of nuclear energy, as
well as the regulation activity within the sphere of nuclear power..
On 24 of May, 2001, according to Government decree N 452, the ANRA was powered
to have functions of State regulation on protection of ionization sources integrity
and against their irradiation harmful impact.
The status of the ANRA was changed again on 27 June 2002, according to the Government decree N 912, in order to respond to the reforming principles implemented into the Armenian System of Government Management. The ANRA was included into the Ministry of Environmental Protection of RA. On 26 December 2002, a new Statute of the ANRA was approved by the Government decree N 2183. The ANRA was renamed, and now it is called the Inspection for State Supervision on Nuclear and Radiation Safety of Utilization of Nuclear Energy under the Ministry of Ecology of RA. According to the new Statute, the ANRA is charged with the following key duty: to perform State regulation within the field of nuclear energy utilization with the main objective - to secure the protection of the population, the personnel involved into the nuclear industry, and environment against the dangerous radiation impact .
Armenia has a single-stage licensing process for NPPs, and the licensing authority
is the ANRA. The licensee is responsible for the safety of nuclear power facilities.
The licensee is obliged by the license to:
· guarantee the keeping of principles, criteria and requirements
on the nuclear and radiation safety, as well as the conditions or acts of the
temporary exploitation permission;
· inform
the ANRA about the deviations of the conditions of the temporary exploitation
permission, as well as the incidents and emergencies during the NPP power unit
exploitation.
On 25 of April, 2001, according to the Government decision N 342, the Science-Research Centre of Nuclear and Radiation Safety was established at the ANRA with the objective to make it possible for the ANRA staff to carry out an independent expertise activity.
On the basis of the Government decree N 389, 22.08.1994, all the rules and norms applicable to nuclear power in Russia have been accepted in Armenia. The ANRA is aware of the fact that some of these regulations need revision. This process is under way.
3.2. Main National Laws and Regulations
The following laws and Government decrees concerning the activities in the
field of nuclear energy use are in force in Armenia:
·
Law on Implementation of modifications and additions
both in the Code of RA on administrative and criminal legal violations, entered
into force on 30 November 1996.
·
Law on Energy of the
Republic of Armenia, entered into force on 1 July 1997.
· The
new Law on Energy of the Republic of Armenia entered into force in March,
2001, and replaced an old one which entered into force on 1 July 1997.
·
Law on Safe Use of
Nuclear Energy for Peaceful Purposes entered into force on 1 March 1999.
· The
amendment to the law on Safe Use of Nuclear Energy for Peaceful Purposes entered
into force on 21 March 2000.
· The
Government Decree N-389, 22.08.1994, on the Implementation in Armenia of Regulations
and Standards on Nuclear and Radiation Safety which are in force in the Russian
Federation.
· The
Government Decree N-401, dated 04.07.1995 on Introduction of Additions in the
Government Decree N-161, dated 05.03.1991 (about the types of activities that
are subject to licensing).
·
The Government Decree N-331,
dated 08.12.1995 on Restart of the ANPP Unit 2, and the Measures for Ensuring
its Further Safe and Uninterrupted Operation.
· The
Government Decree N-465, dated 19.07. 1999, approved the list of objects, which
are of safety importance in the field of nuclear energy use.
· The
Government Decree N-769, dated 22.12. 1999, approved the list of operations
and work positions, which are of safety importance in the field of nuclear energy
use.
· The Government Decree N-746,
dated 13.12.1999, approved the Order of Evacuation of Population from the Contaminated
Territories.
· The Government Decree N-679,
dated 25.10.2000, approved the Order of Providing the Population with the Individual
Protection Means.
·
The Government Decree N-640,
dated 12.07.2001, approved the Rules for Organizing and Conducting the Safety
Expertise in a field of Nuclear Energy Utilization.
·
The Government Decree
N-1263, dated 24.12.2001, approved Special Rules for Nuclear and Radioactive
Materials Transportations.
· The
Government Decree N-765, dated 16.08.2001, approved the Order of State Registration
of Ionisation Irradiation Sources.
·
The Government Protocol N-51, dated 13.12.2001, adopted the Principal Positions
on Planning and Realisation Activities for the Nuclear and Radiation Accidents
Resistance.
· The
Government Decree N-931, dated 27.06.2002, approved the Nuclear and Radioactive
Materials Safety Transportation Rules.
· The
Government Decree N-2013, dated 21.11.2002, approved the Requirements to the
Volume and Structure of Safety Analysis Report on the ANPP Unit 2.
4. CURRENT ISSUES
4.1. General
Nuclear power plays a crucial role in a country's electric energy supply. In Armenia, the share of nuclear electricity generation reaches 40 % of all electricity production. Therefore, to achieve the top level of safety in operation of the ANPP is the central issue of concern for the Government of Armenia.
This problem attracts the attention of all the responsible bodies of the RA.
Since 1996, the Nuclear Energy Safety Council of the President has been acting
in Armenia. Its general duty is to report annually to the President on the real
situation with the nuclear energy safety at the ANPP. The members of the Council
observe in advance all the relevant documents and listen to appropriate specialists
reports before making their decisions. The Council consists of the internationally
acknowledged specialists well known within the world nuclear power sphere.
The Ministry of Energy, defining the policies for the whole energy sector; is, in particular, responsible for the development of the ANPP safe operation programmes, and it acts in close cooperaiton with other responsible bodies.
4.2. Human resources development
Nuclear power in Armenia is not only an important branch of industry providing
the country with the electric energy, it also ensures the employment for the
population of the republic. Nowadays, more than 2000 employees are involved
into the nuclear energy sector activity working both at the ANPP and in the
sphere of nuclear sector supporting services. All of them are the Armenian citizens,
and the majority of them has been graduated from the Armenian State Engineering
University and Yerevan State University. The ANPP staff consists of educated
people of various corresponding specialities. The above mentioned institutes
continue to prepare specialists for the nuclear energy branch.
4.3. Privatisation and deregulation
In June 1999, the Government of Armenia, in accordance with the common strategy
of transfer of the country to the market economy and law in force (Law "About
the Plan of Privatization of State Property of the RA during the years 1999
- 2000" approved by the National Assembly of the RA on 17.01.1999), decided
to privatize 4 Electricity Distribution Companies (ESCs) by the competitive
international tender. Privatization of state companies was implemented to encourage
market competition. The tender was declared, but it failed. In order to make
Armenian Electricity Distribution System more attractive for the potential investors,
those 4 Companies were united into one company which included also 110 kV Transmission
Lines. The new company was called CJSC "Armenian Electric Networks"
(ArmElNet).
On 26 of July 2002, a new tender for privatization of ArmElNet was announced.
The deadline for presentation of proposals was established on 9 of August 2002.
The only one proposal was submitted by the Midland Resources Holding LTD, so
the company was recognized the winner and recommended for the award. On 26 August
2002, the company became an owner of ArmElNet.
On 5 November 2002, the protocol was signed on a transference of the Hrazdan
TPP to the Russian Federation. The power plant became the Russian Federation
property in account of Armenian State loan debt covering.
As to the ANPP, according to the acting laws of the Republic of Armenia - "Energy Law" and Law on "Safe Use of Nuclear Energy for Peaceful Purposes", the nuclear power plant is not subject to privatization.
4.4. Role of the government in the nuclear R&D
The Government is financing the R&D work " Energy Generation and Transmutation
Radwaste by Using the Energy Amplifier" which began in 1998 and will be
finished in 2004. The investigation has been performing by the staff of the
Physical Department of the Yerevan State University.
In 2000, Armenia joined the International Project on Innovative Nuclear Reactors
and Fuel Cycles (INPRO), IAEA initiative, in order to address the needs of economic,
safety, non-proliferation and waste management aspects of nuclear energy and
its fuel cycle with innovative technology.
4.5. Nuclear Energy and Climate Change
Nuclear power plant in Armenia, like those in many countries using nuclear way of electricity generation, is the most ecologically preferable electric energy generating facility from the view of the republic environment cleanliness and natural wealth protection. Unlike the most thermal power plants emitting the CO2 gas, the ANPP makes it possible to keep the country's air purity within the limits of the internationally adopted norms and regulations.
4. 6. Safety and waste management issues
Since the restart of the ANPP, up to 01.01.2003, there have been completed
118 engineering activities and 1058 safety improvement measures. The most important
of them are:
-
Completion of the nuclear
service water system project. This system is intended to endure earthquakes
of high magnitude. Also seismic pumps and other equipment have been installed;
-
7 Fast
closing main steam isolation valves (MSIV) were installed. They will provide
better control in case of a steam line accident and will reduce the risk of
a more serious accident involving overcooling of the primary coolant system
and reactor vessel;
-
12 Steam generator
safety valves (SGSV) were replaced by new ones;
-
2 Safety valves of
the pressurizer were replaced by new ones;
-
Replacement of more
than 12,000 sq.m. of Reactor Department and Auxiliary Building combustible plastic
floors with the non-combustible casting covering was carried out.
-
Replacement of cable
conduits doors and Turbine hall doors with the 90 min. fire-resistant doors
was carried out.
-
A new
fire detection and alarm system was put into operation. 700 Smoke/fire type
detectors were installed, of which 70 are blow resistant;
-
An analysis of the
material structure of the reactor vessel and primary circuit piping has been
carried out by using various modern methods;
-
The
installation of a leak detecting system from the primary to the secondary circuit
was implemented;
-
The bearing metallic
structures (columns) in the turbine hall building and in the emergency diesel-generator
room have been coated with fire-resistant material.
-
A seismic
safety related re-evaluation programme for Unit 2 has been developed.
-
A multifunctional
simulator, for training the operators, was put into operation.
-
Reconstruction of feed-water distribution
headers inside the Steam Generator (SG) 1 and 6 was fulfilled.
-
Review of SIAZ logic and scope
in regard with the Service Water System implementation.
-
Replacement of emergency condenser
tubing in low-pressure cooling system (AK) was completed.
-
Commissioning of new system for
Reactor Cooling Pump (RCP) shaft seal was performed.
-
Installation and commissioning
of diesel-pump for feeding SG in the event of full de-energizing were completed.
-
Reconstruction of Turbo
Generator (TG) -3 shaft seal system was completed.
-
Scenario was developed for reactor
transfer to safe controlled condition in seismic event.
-
Installation of a compressor for
annual pressure tests of SG and RCP compartment tightness.
-
Installation of two sulphur hexafluoride (SF6) breaker
sets in main generator circuits.
-
Reconstruction of TG-4 shaft sealing system.
-
Improvement of two DG startup oil supply system.
-
Implementation of pressurizer Safety Valve(SV) function
for reactor cold overpressure protection.
-
Installation of additional circuit breakers for control
circuits of power-operated valves (410 pcs).
-
Reconstruction of two SG -2;3 (Steam Generator)
distributing headers.
-
Replacement of two obsolete Reverse Motor Generator (RMGs).
-
Installation of fire alarm in Units 1;2 boron compartment.
- Development and implementation of "Feed-and-Bleed" procedure.
According to the ANPP design, an annual Unit 2 radioactive waste (radwaste)
generation is:
308 m3 of solid LLW; 1,5 m3 of solid MLW; 0,3 m3 of solid HLW; 108 m3 of liquid
radwaste.
At the ANPP, there are storages for both solid and liquid radwaste.
High-level waste is stored in a special room of the Reactor building. The storage
area consists of 380 cells. The storage capacity is 78.34 m3.
Medium-level radwaste is stored in the Special Building. Storage capacity is
1001,22 m3.
Also, the deep evaporating facility containers are stored temporarily on the
upper unheated floor of the Special Building. Its effective storage volume is
655 m3 (3000 containers).
The storage facility for low-level radwaste consists of two compartments, each
measuring 27x36x8.9 m. The total storage volume is about 17050 m3.
Liquid radwaste is stored in the Special Building. Liquid wastes (evaporator residues) generated in the evaporators during drain water reprocessing are collected in the evaporator residue tank.
4.7. Other issues
In 2002, in Armenia, the All-Armenian Atomic Power Engineers Association was established. The founders of the Association are specialists from such organizations as the Ministry of Energy of RA, Armenian NPP, Armenian Nuclear Regulatory Authority (ANRA), State Engineering University (SEUA), and other nuclear power specialists.
The main objectives of the Association are:
- to
promote the scientific idea development in nuclear engineering;
- to
support the nuclear energy propaganda and further development;
- to
conduct testing in the field of atomic energy according to the established procedures;
- to
ensure the propaganda of nuclear energy by:
a) publishing articles, magazines, books,
dictionaries, reference books;
b) organizing scientific seminars;
c) creating radio-programmes, documentary-
and scientific films, video cassettes devoted to the nuclear energy;
d) creating computer training- and demonstration programmes;
- to organize public discussions of the problems relevant to nuclear energy.
REFERENCES
[1] "Armenian Economic Trends" issued by the European Commission,
DGIA, NIS/TACIS services.
[2] Investment Guide of Armenian Development Agency (1998).
[3] Specifics and Phases of the Economic Reforms in Armenia in 1991-1998, Ministry
of the State Statistics.
[4] Manual on the Climate Data for the Construction Design in Armenia.
[5] Data & Statistics/The World Bank, www.worldbank.org/data.
[6] IAEA Energy and Economic Database (EEDB).
[7] IAEA Power Reactor Information System (PRIS).
[8] EC TASIC Project N Europe Aid /112/135/C/SV/Multi " Energy Consumption
Forecast
Appendix 1.
International, Multilateral and Bilateral Agreements
|
|
||
|
AGREEMENTS
WITH THE AGENCY |
||
|
|
||
|
Entry into force: |
5
May 1994 |
|
|
|
|
|
Signed: |
29
September 1997
|
|
|
|
|
|
|
|
|
|
No
reply |
|
|
|
|
|
Signed:
|
30
September 1999
|
|
|
|
|
|
|
Non-Party |
|
|
||
|
RELEVANT
INTERNATIONAL TREATIES OR AGREEMENTS |
||
|
|
|
|
|
Acceded: |
15
July 1993 |
|
|
|
|
|
Entry into force:
|
23
September 1993
|
|
|
|
|
|
Entry into force:
|
24
September 1993
|
|
|
|
|
|
Entry into force:
|
24
September 1993
|
|
|
|
|
|
Entry into force:
|
24
November 1993
|
|
|
|
|
|
|
Non-Party |
|
|
|
|
|
|
Not
signed |
|
|
|
|
|
|
Not
signed |
|
|
|
|
|
Entry into force:
|
20
December 1998
|
|
|
|
|
|
|
Not
signed |
|
|
|
|
|
|
Non-Member |
|
|
|
|
|
|
Not
adopted |
|
|
|
|
|
|
No reply |
|
|
|
|
|
|
1 October 1996 |
|
|
||
|
BILATERAL
AGREEMENTS |
||
|
|
|
|
|
Entry into force |
17 March 1994 |
|
|
|
|
|
Entry into force: |
22 April 1999 |
|
|
|
|
|
Entry into force
|
10 January 2001
|
Appendix 2.
DIRECTORY OF THE MAIN ORGANIZATIONS, INSTITUTIONS AND COMPANIES INVOLVED IN NUCLEAR POWER RELATED ACTIVITIES
|
NATIONAL
ATOMIC ENERGY AUTHORITY |
|
|
|
|
|
Ministry
of Energy |
Tel: 374 1 52
19 64 |
|
Government
House |
Fax: 374 1 15 16 87 |
|
2,
Republic Square |
E-mail: minenr@arminco.com |
|
375010
Yerevan, Republic of Armenia |
|
|
|
|
|
Atomic
Energy Department |
Tel: 374 1 56
27 76 |
|
|
Fax: 374 1 505 439 |
|
|
E-mail: atomen@freenet.am |
|
|
|
|
Armenian
Nuclear Regulatory Authority |
Tel: 374 1 58
19 62; 56 31 24 |
|
Tigran
Mets av. 4 |
Fax: 374 1 90
68 74 |
|
375010
Yerevan, Republic of Armenia |
E-mail: head@asas.asrmenia.su |
|
|
|
MAIN POWER UTILITY
|
|
|
|
|
|
Armenian
Nuclear Power Plant |
Tel: 3741 28
85 80 |
|
Metsamor,
377766 |
Fax: 3741 15
18 60 |
|
Armavir region 6 |
E-mail: ANRA@anra.am
|
|
Republic
of Armenia |
|
|
|
|
MANUFACTURES AND SERVICES
|
|
|
|
|
|
Armatom |
Tel: 374 1 74
21 30 |
|
Admiral
Isakov, 50 |
Fax: 374 1 15
16 87 |
|
375114 Yerevan, Republic of Armenia |
E-mail: armatom@freenet.am |
|
|
|
|
Atomservice |
Tel/Fax: 3741
28 55 32 |
|
Metsamor,
377766 |
|
|
Armavir
region 6 |
|
|
Republic
of Armenia |
|
|
|
|
HIGH ENERGY RESEARCH INSTITUTES, UNIVERSITIES
AND OTHER ORGANIZATIONS
|
|
|
|
|
|
Institute
of Energy |
Tel: 374 1 65
54 49 |
|
Amaranotsayin,
127, |
|
|
375147
Yerevan, Republic of Armenia |
|
|
|
|
|
Atomenergoseysmoproject |
Tel: 374 1 58
06 49 |
|
Hrazdan
Defile, YerGes-2 |
Fax: 374 1 151
805 |
|
375015
Yerevan, Republic of Armenia |
|
|
|
|
|
Yerevan Physics Institute |
|
|
|
|
|
Yerevan State University |
|
|
|
|
|
National Academy of Sciences of Armenia |
|